

GLOBAL GWTC (GWTC-2)
Download all historical data here (updated for March 2024!)
NEW: GWTC-2 Based Global Indicators of Climate Change
GWTC-2 Realtime Forecasts
GWTC-2 Animations Page
FILE INFO:
The total amount of data is about 12GB. Thus, the GWTC-2 has been broken down into month-by-month .csv files of ~25MB each. Each file is structured with each row representing space (gridpoints), and each column representing time (days), with headers for both. Thus, each file will have 259,921 rows (1 date header at the top, and 259,920 locations thereafter), and a variable number of columns (depending on the number of days in the month). The date header is an Excel-readable date (28856 = 1-Jan-1979). Note that GWTC-2 types are defined according to a "local day" for each location; roughly local midnight to local midnight (+/- 3 hours; see Table 1 of Lee, 2019). The first two columns are the latitudes and longitudes, respectively. The rest of the data are the WT codes (see Metadata table below) for each day at each location (0 = missing data). Due to adjustment for time zones, the last day of the most recent month will be all zeros (missing data) until the data release for the following month; and the data for 1-Jan-1979 is missing for about half of the globe.
GWTC2 weather types during the European Cold Air Outbreak of January 1987.
Much like the original gridded weather typing classificaiton (GWTC) for North America, the second version of the GWTC (GWTC-2) is a geographically- and seasonally-relative classification of multivariate surface weather conditions (weather types). However, it has now been expanded to include the entire globe at a 0.5° by 0.5° resolution, yielding daily weather types at 259,920 locations, since 1979 through the near-present (about 1 month). This equates to over 3.7 billion location-days classified.
Some other key updates have been added to GWTC-2 as well:
1) the classification is derived from a new underlying dataset - the Climate Forecast System (CFS; reanalysis and the V2 operational analysis) - representing the most state-of-the-art climate model used by NOAA;
2) it is now calculated using more robust techniques for determining deseasonalized z-scores (by substituting medians and inter-quartile ranges for means and standard deviations);
3) the resulting weather types (WTs) have been modified to better capture truly abnormal weather. That is, instead of an even 33.3% split of the z-score distribution among the 3 temperature and humidity categories, there is now a 25-50-25 split; and
4) a simpler spatial smoothing process, whereby each location-day is classified into the WT that represents the mode of all adjacent locations (and the location-day of interest), with the exception of CFPs and WFPs, which are not smoothed.
In addition to allowing the GWTC to expand to the global domain, the use of CFS data also allows the computation of GWTC-2 forecasts to be greatly streamlined (as no spatial or temporal interpolation will be necessary since the forecast data and historical data will be from the same underlying dataset); and will allow for more frequent updates - monthly rather than annually.
The GWTC-2 still uses six near-surface weather variables (temperature, dew point, sea-level pressure, cloudiness, wind speed, and wind direction) to classify every day at each location into one of 11 different weather types. The nine 'core weather types' mostly relate to different temperature and humidity conditions, and the two transitional weather types identify the passage of traditional cold fronts and warm fronts (see image below).
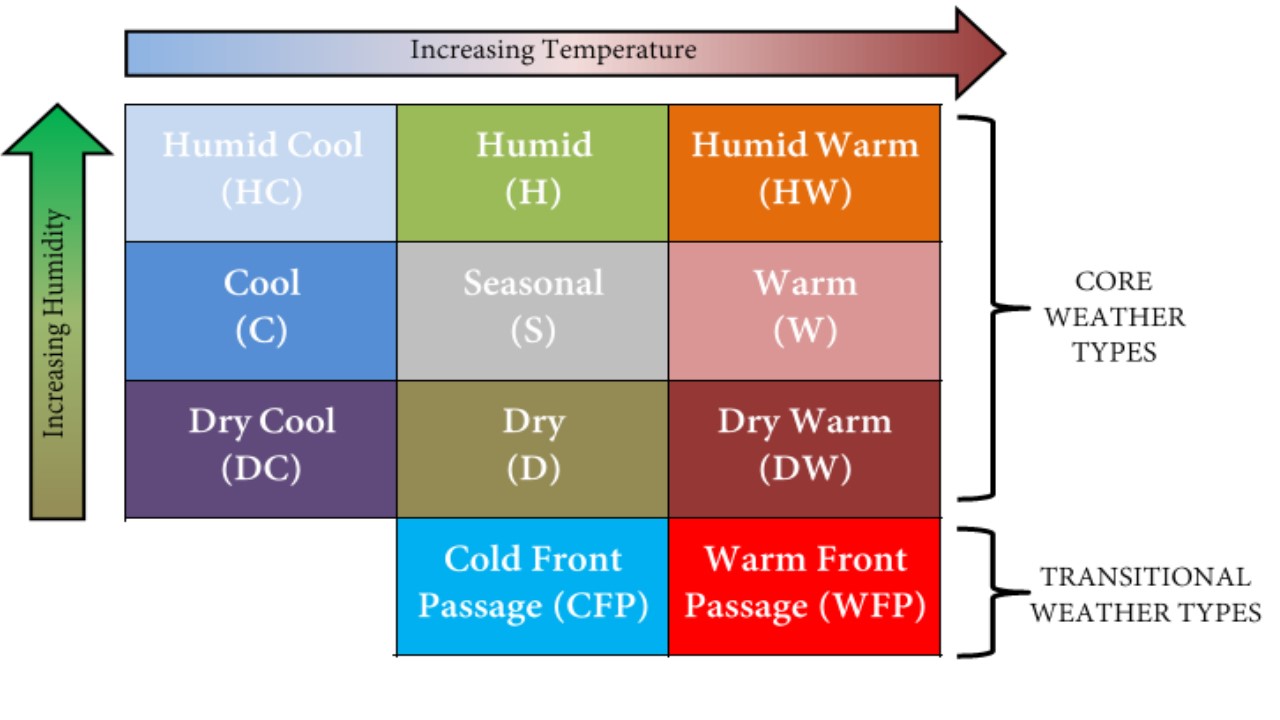
GWTC weather types (modified from Lee, 2015)
Metadata table:
Code |
Type |
Abb |
| 0 | Missing | N/A |
| 11 | Humid Cool | HC |
| 12 | Humid | H |
| 13 | Humid Warm | HW |
| 21 | Cool | C |
| 22 | Seasonal | S |
| 23 | Warm | W |
| 31 | Dry Cool | DC |
| 32 | Dry | D |
| 33 | Dry Warm | DW |
| 72 | Cold Front Passage | CFP |
| 73 | Warm Front Passage | WFP |
The idea behind the GWTC and GWTC-2 was to be somewhat of a 'feels-like' classification. For example, say in Cleveland, Ohio in mid-January, there is a daytime high temperature of 59°F (15°C). To someone in Cleveland, that would be relatively warm for that time of the year. However, to someone that lives in Miami or Los Angeles, that same temperature would be described as cold, even for winter. Similarly, if that temperature were to happen in mid-August in Cleveland, most residents would think it is very cold for summer! In addition to this 'spatiotemporal-relativity', the high degree of spatial resolution and the completely automated process is what makes the GWTC different from other similar classifications, such as the Spatial Synoptic Classification (SSC; Sheridan, 2002). That is, instead of finding traditional air masses, the GWTC merely classifies multivariate surface weather situations relative to climatological normal. Thus, associating GWTC weather types to human health and other biological systems that might respond to multivariate departures from normal more-so than raw meteorological conditions may prove useful.
Please feel free to use the GWTC-2 data free of charge for scientific research purposes. I only ask that you cite this webpage as the source of the data, and the publications outlining the development of the original GWTC and its global-scale expansion:
Lee CC. 2020. Trends and variability in airmass frequencies: indicators of a changing climate. Journal of Climate 33(19) 8603-8617. DOI: 10.1175/JCLI-D-0049.1.
Lee CC. 2019. The Gridded Weather Typing Classification version 2: a Global Scale Expansion. International Journal of Climatology 40(2) 1178-1196. DOI: 10.1002/joc.6263.
Lee CC. 2014. The development of a gridded weather typing classification scheme. International Journal of Climatology 35(5), 641-659. DOI: 10.1022/joc.4010.
Please let me know if you have used the GWTC or GWTC-2 in any of your research, and I will list it here.