Lecture 7: The Basics of Economic Growth |
|||||||||||||||||||||||||||||||||||||||||||||||||||||||||||||||||||||||||||||
|
Now let us return once more to our basic graph, Figure 5-5 repeated here as Figure 7-1. If you looked at per capita GDP in different countries, you would notice substantial differences in per capita income. If you looked at many nations, you would also find substantial differences over time in the level of per capita income. |
|||||||||||||||||||||||||||||||||||||||||||||||||||||||||||||||||||||||||||||
|
|
|||||||||||||||||||||||||||||||||||||||||||||||||||||||||||||||||||||||||||||
The explanation lies in the lower left-hand corner, in the production function. Different nations have different levels of productivity. That is the subject of this lecture. |
|||||||||||||||||||||||||||||||||||||||||||||||||||||||||||||||||||||||||||||
|
We have already discussed the Malthusian Model. Writing in the late 18th century, Thomas Malthus argued that the world was doomed to a standard of living where people were barely able to survive. His reasoning was that population tended to grow at a much faster rate than the resources needed to sustain that population, especially food. Therefore, at some point, population growth would need to be checked, by famine or some other means, until the population was small enough to be supported by the available food supply. |
|||||||||||||||||||||||||||||||||||||||||||||||||||||||||||||||||||||||||||||
|
Was Malthus right? Most of the data in Figure 7-2 supports the argument. The top panel shows the population of England during the Middle Ages. Population takes a steep decline during the years of the Black Death before growing once again. The second panel shows the average real wage during the same years - a good way of estimating the standard of living of the average worker. Notice that the real wage declines when the population is increasing and increases during the years of the Black Death. In other words, as people died off, more resources were available for those who survived. The Black Death was an economic boon to those who lived through it. Perhaps Malthus was correct. |
|||||||||||||||||||||||||||||||||||||||||||||||||||||||||||||||||||||||||||||
|
You know from your own experience that Malthus was ultimately wrong. The world’s population has skyrocketed this century, but we have more than enough food to feed everyone, with some left over. Those who go hungry usually cannot get to the food, as in Somalia, where local warlords kept it from the people. Meanwhile, the rest of world struggles to get rid of excess crops. Look again at Figure 7-2. Notice that during the 17th century (the 1600s), both population and real wages were increasing. In other words, the average worker was becoming better off even though there were more people. In fact, the very end of the graph shows real wages in England going off the chart! Malthus spoke too soon. |
|||||||||||||||||||||||||||||||||||||||||||||||||||||||||||||||||||||||||||||
|
|
|||||||||||||||||||||||||||||||||||||||||||||||||||||||||||||||||||||||||||||
So what happened? If you remember your history, you know that the Industrial Revolution occurred first in England around 1800. This is about the time when real wages started to increase dramatically, as shown in Figure 7-2. However, the real wage was able to increase, even though population was increasing, beginning in the 1600s. This was a period of significant change in England. Several kings had sought to increase the Crown’s revenue by seizing goods for “public purposes” (in other words, because the King wanted them), paying judges so they would rule in the King’s favor, adding new members to Parliament so that new taxes could be passed, and forcing rich merchants to make loans to the Crown that were never repaid, among other things. |
|||||||||||||||||||||||||||||||||||||||||||||||||||||||||||||||||||||||||||||
|
The excesses of the Kings led to a civil war in England. Eventually, in 1688, Parliament brought in a new King and Queen, William and Mary of Orange (The Netherlands) in what has been called “The Glorious Revolution.” It was glorious because William and Mary agreed that only Parliament had the right to impose taxes without interference, that the right of the King to seize property and force loans would be subject to common law, and that the King should in all other ways abide by the laws governing the realm. In other words, the king was under the same law as other citizens. Getting to this point had been a long process in England. The first significant milestone in this process was the signing of the famous Magna Carta in 1215, where an English king first consented to the idea that all came under the law, even the king. In 1688 the process was complete and the law was supreme. From that time forward, England was also economically different. |
|||||||||||||||||||||||||||||||||||||||||||||||||||||||||||||||||||||||||||||
|
It was no accident that the industrial revolution happened in England first. Since then, many nations have seen huge increases in their standards of living. But can we really expect per capita GDP to continue to grow? Or will Malthus ultimately be right once again? Persistent economic growth is a relatively new phenomena compared to the many centuries of human misery and poverty. Furthermore, although we have seen dramatic increases in the standard of living for many countries over the last three centuries, many more countries have seen little or no economic growth. Our main task in this lecture is to understand the source of economic growth and understand something of our future prospects. |
|||||||||||||||||||||||||||||||||||||||||||||||||||||||||||||||||||||||||||||
The Pattern of Economic Growth In History |
|||||||||||||||||||||||||||||||||||||||||||||||||||||||||||||||||||||||||||||
|
If the term “economic growth” has crossed your path at all, it was most likely through a news report that said something like the following: “The U.S. economy grew 4.1 percent in the preceding quarter.” Although such reports are important, we are interested in a longer period in this discussion. To get our standard of living to double or triple requires more than a couple of years of economic expansion. The persistent growth of per capita GDP over the last 300 years is best described as unprecedented and gradual. |
|||||||||||||||||||||||||||||||||||||||||||||||||||||||||||||||||||||||||||||
The Long View |
|||||||||||||||||||||||||||||||||||||||||||||||||||||||||||||||||||||||||||||
|
Throughout most of recorded history (and presumably before then), most people have lived in poverty. There have been civilizations that were able to increase the standard of living for a portion of their populations, but not to the degree we have seen in modern times and not for the vast majority of their citizens. For example, two thousand years ago, Rome was a very advanced city, with many wealthy citizens that enjoyed a life of luxury. However, they were able to enjoy that lifestyle on the backs of the many slaves that supported their extravagance and lived in poverty. Eventually, the city and the empire fell into ruins. |
|||||||||||||||||||||||||||||||||||||||||||||||||||||||||||||||||||||||||||||
|
Today’s economically advanced countries have mostly middle-class populations. That is, most of the population enjoys a lifestyle where they have some amount of affluence that continues to increase over time. This is very different, or unprecedented. |
|||||||||||||||||||||||||||||||||||||||||||||||||||||||||||||||||||||||||||||
|
This tremendous and persistent rise in the standard of living has been gradual. Table 7-1 shows the increases in per capita GDP for the United States and the United Kingdom since the 18th century. Our standard of living in 1998 was almost 22 times higher that it had been in 1776. But just like the tortoise who beat the hare by slow, steady progress, this tremendous economic growth was achieved slowly over time. The average growth in per capita GDP was only 1.8% annually. Over time, small changes add up to large results. |
|||||||||||||||||||||||||||||||||||||||||||||||||||||||||||||||||||||||||||||
|
|
|||||||||||||||||||||||||||||||||||||||||||||||||||||||||||||||||||||||||||||
Recent History |
|||||||||||||||||||||||||||||||||||||||||||||||||||||||||||||||||||||||||||||
|
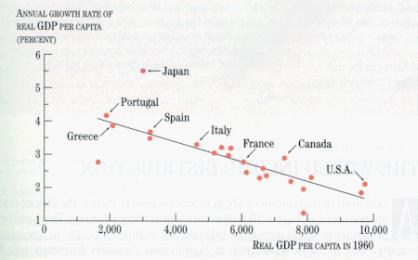
At the end of World War II, per capita GDP in Europe was well below that of the United States. The difference has essentially disappeared as these countries have caught up with the United States. For the past twenty years, other countries such as South Korea and Taiwan have exhibited growth rates well above that of the United States. While their per capita GDP has not yet caught up with the United States, most economists agree that it is only a matter of time before that happens. |
|||||||||||||||||||||||||||||||||||||||||||||||||||||||||||||||||||||||||||||
|
By way of illustration, Figure 7-3 shows per capita GDP for the United States (or at least the log of per capita GDP) and for a country closing the gap, catching up with the United States. During the catch-up period, GDP growth is high, but slows as the country approaches the leader. The catch-up Theorem holds that countries with low per capita GDP will eventually catch up with the “leader”, the country with the highest level of per capita GDP. During the period of catching up, the laggard will have a higher growth rate than the leader (how else do you catch up). As it catches up, the growth rate will slow and eventually converge to that of the leader. |
|||||||||||||||||||||||||||||||||||||||||||||||||||||||||||||||||||||||||||||
|
|
|||||||||||||||||||||||||||||||||||||||||||||||||||||||||||||||||||||||||||||
Other countries may well be on their way to closing the gap. Following the end of the Cold War, many former members of the Soviet Empire have begun to make significant economic progress. Most economists fully expect countries like Poland, Hungary, and the Czech Republic to close the gap, perhaps not immediately, but certainly in the next 40 years. Following Mao’s death, China began to turn to a market economy. In doing so, China has achieved substantial economic growth. There is reason to believe that China may well be on its way to catching up with the United States. In the past few years, some – but not all – economists have begun to think that India may be on the way to growing faster than the US. |
|||||||||||||||||||||||||||||||||||||||||||||||||||||||||||||||||||||||||||||
|
|
|||||||||||||||||||||||||||||||||||||||||||||||||||||||||||||||||||||||||||||
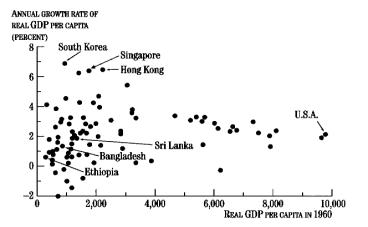
As Figure 7-4 shows, other countries have not done as well. For example, at the end of World War II, Argentina had a per capita GDP somewhere between Canada and the United States. Since then, Argentina has slipped, and now has a relatively low GDP. The United Nations classifies Argentina as a “Developing Country”, though until quite recently it would have been more proper to classify Argentina as an “Undeveloping Country”. Other countries such as Bangladesh, Afghanistan, Madagascar and Ethiopia have seen little growth in per capita GDP or negative growth in GDP. |
|||||||||||||||||||||||||||||||||||||||||||||||||||||||||||||||||||||||||||||
How did it happen? |
|||||||||||||||||||||||||||||||||||||||||||||||||||||||||||||||||||||||||||||
|
We should be very interested in understanding how we achieved these gains in our standard of living. If we can identify where this growth comes from, we might be able to understand if it is possible to continue this process. |
|||||||||||||||||||||||||||||||||||||||||||||||||||||||||||||||||||||||||||||
|
What accounts for economic growth? We have a simple economic equation to explain the economics of growth. We know that a good equation for describing the level of a country’s GDP at time t is: |
|||||||||||||||||||||||||||||||||||||||||||||||||||||||||||||||||||||||||||||
Real GDP = AK1/3L2/3, |
|||||||||||||||||||||||||||||||||||||||||||||||||||||||||||||||||||||||||||||
|
|
|||||||||||||||||||||||||||||||||||||||||||||||||||||||||||||||||||||||||||||
|
where |
|||||||||||||||||||||||||||||||||||||||||||||||||||||||||||||||||||||||||||||
|
A = level of technology |
|||||||||||||||||||||||||||||||||||||||||||||||||||||||||||||||||||||||||||||
|
K = amount of capital |
|||||||||||||||||||||||||||||||||||||||||||||||||||||||||||||||||||||||||||||
|
L = labor force |
|||||||||||||||||||||||||||||||||||||||||||||||||||||||||||||||||||||||||||||
|
The term “level of technology” is simply a way of stating how much output can be obtained with a given level of capital and labor. In other words, if we do not change the amount of labor or capital, it is still possible to produce more goods and services if we have a better or faster or more efficient way of production - what we call technological progress. This term is important and we will discuss it in more detail later. |
|||||||||||||||||||||||||||||||||||||||||||||||||||||||||||||||||||||||||||||
|
This equation is good because it identifies three inputs that cause real GDP to increase. However, we are interested in changes in the standard of living or per capita GDP. To get that we need to divide real GDP by the population. For simplicity, let’s assume that the population we’re interested in is the working population. This isn’t exactly true, but it allows us to divide both sides of this equation by L to get per worker GDP, which is very similar to per capita GDP. |
|||||||||||||||||||||||||||||||||||||||||||||||||||||||||||||||||||||||||||||
Real GDP per worker = (AK1/3L2/3)/L, |
|||||||||||||||||||||||||||||||||||||||||||||||||||||||||||||||||||||||||||||
|
which can be rewritten as |
|||||||||||||||||||||||||||||||||||||||||||||||||||||||||||||||||||||||||||||
Real GDP per worker = A * K1/3 * L2/3 * L-1, |
|||||||||||||||||||||||||||||||||||||||||||||||||||||||||||||||||||||||||||||
|
If you remember your algebra, L2/3 multiplied by L-1 equals the sum of their exponents or L-1/3. Making this substitution gives us |
|||||||||||||||||||||||||||||||||||||||||||||||||||||||||||||||||||||||||||||
Real GDP per worker = A(K/L)1/3, |
|||||||||||||||||||||||||||||||||||||||||||||||||||||||||||||||||||||||||||||
|
This equation tells us that our standard of living depends on two things: |
|||||||||||||||||||||||||||||||||||||||||||||||||||||||||||||||||||||||||||||
|
· Technological progress |
|||||||||||||||||||||||||||||||||||||||||||||||||||||||||||||||||||||||||||||
|
· An increase in the amount of capital per worker |
|||||||||||||||||||||||||||||||||||||||||||||||||||||||||||||||||||||||||||||
|
Technological progress means that we are finding better and smarter ways of producing goods and services. An increase in the amount of capital per worker means that we are giving each worker, on average, more tools with which to produce goods and services. Each of these is a source of economic growth, so we will want to discuss each in turn, starting with capital per worker. |
|||||||||||||||||||||||||||||||||||||||||||||||||||||||||||||||||||||||||||||
Capital Growth as a Source of Economic Progress |
|||||||||||||||||||||||||||||||||||||||||||||||||||||||||||||||||||||||||||||
|
In most countries, both population and the labor force are growing. If there is no capital growth, then the amount of capital per worker will shrink. Some capital accumulation is required to keep the amount of capital per worker constant. And indeed some capital accumulation is called for to accommodate technological change. |
|||||||||||||||||||||||||||||||||||||||||||||||||||||||||||||||||||||||||||||
|
While capital accumulation is both important and desirable, generations of politicians and other deep thinkers have carried the point too far and suggested that the way to solve all of our economic problems is to increase our saving rate so that we have more rapid capital accumulation. If we do so, or so the argument goes, the capital stock will grow at a faster rate than the labor force and we will have additional growth in per capita GDP. It certainly explains why Germany caught up with us after World War II and why Korea is catching up with us now. |
|||||||||||||||||||||||||||||||||||||||||||||||||||||||||||||||||||||||||||||
|
The difficulty is that those rates are unsustainable. To illustrate the point, suppose that our GDP is $8 trillion and that our capital stock is $20 trillion. Both numbers are slightly off, but it helps to work with round numbers. Suppose for sake of argument, that we were to start investing 50% of our GDP, adding it to the capital stock. (To make life easy, we assume no growth in total factor productivity and no growth in either the population or the labor force). Now our economic data would look something like the Table 7-3: |
|||||||||||||||||||||||||||||||||||||||||||||||||||||||||||||||||||||||||||||
|
|
|||||||||||||||||||||||||||||||||||||||||||||||||||||||||||||||||||||||||||||
That is, we would have achieved a significant boost in per capita GDP, now growing at 6.7% a year. |
|||||||||||||||||||||||||||||||||||||||||||||||||||||||||||||||||||||||||||||
|
The difficulty comes if we try to sustain this rate of growth. The next table shows what happens to the economy over the next few years. This table shows that the growth rate drops. In the ten years shown here, the rate has dropped from 6.7 percent to 3.3 percent. Why? The 20% growth in the capital stock leads to only a 6.7 percent growth in GDP. To continue to grow at 6.7% a year, the capital stock would need to continue to grow at 20% a year, and that would mean that investment would need to continue to grow at 20% a year. If investment is to grow at 20%, it must become an increasing percentage of GDP. Ultimately, it will have to exceed 100% of GDP, which obviously cannot be. |
|||||||||||||||||||||||||||||||||||||||||||||||||||||||||||||||||||||||||||||
|
In short, boosts in the saving rate can cause temporary boosts in the growth rate, but it is not a source of permanent change in the growth of GDP. Table 7-4 shows what happens if the process continues |
|||||||||||||||||||||||||||||||||||||||||||||||||||||||||||||||||||||||||||||
|
|
|||||||||||||||||||||||||||||||||||||||||||||||||||||||||||||||||||||||||||||
Technological Progress as a Source of Economic Growth |
|||||||||||||||||||||||||||||||||||||||||||||||||||||||||||||||||||||||||||||
|
If the economic gains from increasing the capital stock are limited, then economic growth over time must be due mostly to technological change, sometimes referred to as technological progress or increases in factor productivity. Whatever we call it, it refers to anything that allows us to produce more goods and services with the same amount of capital and labor. That sort of progress can come in a number of different forms, so it is worth spending some time to talk about each. |
|||||||||||||||||||||||||||||||||||||||||||||||||||||||||||||||||||||||||||||
New inventions and discoveries |
|||||||||||||||||||||||||||||||||||||||||||||||||||||||||||||||||||||||||||||
|
Put quite simply, we know more than our ancestors did. New machines and new processes are invented every day. In many cases, these inventions seem to occur exogenously, through fortuitous discoveries. In other cases, the discoveries occur because people or businesses or governments invest in research and development. |
|||||||||||||||||||||||||||||||||||||||||||||||||||||||||||||||||||||||||||||
|
A warning: do not look for dramatic breakthroughs. Technology appears to be a trend-like process or a series of small improvements on existing technologies. Consider, for instance |
|||||||||||||||||||||||||||||||||||||||||||||||||||||||||||||||||||||||||||||
|
· The steam engine |
|||||||||||||||||||||||||||||||||||||||||||||||||||||||||||||||||||||||||||||
|
· The tractor |
|||||||||||||||||||||||||||||||||||||||||||||||||||||||||||||||||||||||||||||
|
· The electric light bulb |
|||||||||||||||||||||||||||||||||||||||||||||||||||||||||||||||||||||||||||||
|
· The computer (personal or otherwise) |
|||||||||||||||||||||||||||||||||||||||||||||||||||||||||||||||||||||||||||||
|
The initial form of many new technologies is crude and relatively inefficient, requiring following improvements to make the technology viable. Once in while, a dramatic breakthrough will occur, with immediate and widespread implications for an economy. The moveable type printing press would be a rare example of this type of invention, as it enabled a rapid diffusion of knowledge and ideas throughout Europe. |
|||||||||||||||||||||||||||||||||||||||||||||||||||||||||||||||||||||||||||||
Diffusion of the knowledge |
|||||||||||||||||||||||||||||||||||||||||||||||||||||||||||||||||||||||||||||
|
New inventions and new knowledge is not enough. People have to know about it and decide that they can benefit from the adoption of the new technology before they can put it to use. For example, there were no fewer than 17 patents filed for a mechanical sewing machine. Only one of these machines ever became widely adopted, thanks to the genius of the inventor and the marketing prowess of Mr. Singer, the founder of the sewing machine company that bears his name. The other 16, although perhaps good ideas, never became widely adopted. Just having a new gadget does not ensure that total factor productivity will increase. |
|||||||||||||||||||||||||||||||||||||||||||||||||||||||||||||||||||||||||||||
New types of Industrial Organization |
|||||||||||||||||||||||||||||||||||||||||||||||||||||||||||||||||||||||||||||
|
New types of businesses are important in promoting economic efficiency. Three traditional examples come to mind. |
|||||||||||||||||||||||||||||||||||||||||||||||||||||||||||||||||||||||||||||
|
· Several hundred years ago, the British pioneered the notion of a limited liability corporation, the predecessor of our modern industrial corporation. ATT, for example, has current capital of about $60 billion. That represents the investment of millions of persons. The telecommunications giant would not be feasible without millions of investors and in turn they would not be willing to invest without the assurance of limited liability. |
|||||||||||||||||||||||||||||||||||||||||||||||||||||||||||||||||||||||||||||
|
· Also, consider the invention of the modern financial intermediary. The modern banking industry makes possible a lot of business dealings that would not have been possible even 50 years ago. |
|||||||||||||||||||||||||||||||||||||||||||||||||||||||||||||||||||||||||||||
|
· John D. Rockefeller made a lot of his fortune by pioneering the first "national" corporation that could do business thorughout the country. |
|||||||||||||||||||||||||||||||||||||||||||||||||||||||||||||||||||||||||||||
Increased Specialization |
|||||||||||||||||||||||||||||||||||||||||||||||||||||||||||||||||||||||||||||
|
When the Constitution was adopted, transportation was very limited. George Washington’s trip from Mount Vernon to New York, where he took the oath of office, took several weeks. A letter mailed from Mount Vernon to New York also took weeks. Today, the drive takes about four to five hours, and requires less than an hour by airplane. We now expect cell phones with built-in Internet access, assuring rapid communication. The improvement in transportation and communication makes increases specialization possible, since one or two firms meet the demands of the entire country or in some cases the entire planet. |
|||||||||||||||||||||||||||||||||||||||||||||||||||||||||||||||||||||||||||||
|
Americans have become somewhat jaded to this process, but it is nonetheless remarkable. We think nothing of logging onto the Internet and ordering a book from a company like Amazon. If you stop and think about all the processes involved in making this happen, you will see that it takes: |
|||||||||||||||||||||||||||||||||||||||||||||||||||||||||||||||||||||||||||||
|
· Interconnected computers constituting the Internet. |
|||||||||||||||||||||||||||||||||||||||||||||||||||||||||||||||||||||||||||||
|
· A bank willing to issue you a credit card, which pays Amazon essentially immediately and expects you to pay them in time. (Some banks actually prefer that you not pay on time so they earn more interest.) |
|||||||||||||||||||||||||||||||||||||||||||||||||||||||||||||||||||||||||||||
|
· Highly sophisticated computer software to keep Amazon going. |
|||||||||||||||||||||||||||||||||||||||||||||||||||||||||||||||||||||||||||||
|
· The ubiquitous United Parcel Service, which actually delivers the book. |
|||||||||||||||||||||||||||||||||||||||||||||||||||||||||||||||||||||||||||||
|
· A legal system ensuring these parties can work together. |
|||||||||||||||||||||||||||||||||||||||||||||||||||||||||||||||||||||||||||||
|
They all tie the United States into the largest single market in the world. |
|||||||||||||||||||||||||||||||||||||||||||||||||||||||||||||||||||||||||||||
Human Capital |
|||||||||||||||||||||||||||||||||||||||||||||||||||||||||||||||||||||||||||||
|
The modern American Labor Force is better educated today than in the past, and all economists stress the importance of investment in education. We refer to this as an investment in human capital, and we increasingly believe that it may be as important as the investments we make in physical capital and in research and development. This is not an endorsement of higher education, though that does make a difference. Education does not have to take place in the classroom (we learn a lot about our jobs by just doing them). Indeed, not all classroom education is oriented to human capital creation (a course in French Literature may be very worthy, but is unlikely to make you more productive). |
|||||||||||||||||||||||||||||||||||||||||||||||||||||||||||||||||||||||||||||
What Causes Technological Progress? |
|||||||||||||||||||||||||||||||||||||||||||||||||||||||||||||||||||||||||||||
|
If technological change is so important for economic growth, we need to understand what causes technological change. |
|||||||||||||||||||||||||||||||||||||||||||||||||||||||||||||||||||||||||||||
Economic Freedom, Incentives, and Growth |
|||||||||||||||||||||||||||||||||||||||||||||||||||||||||||||||||||||||||||||
|
So far, we have secured a link between technological change and economic growth. The deeper question is “What causes technological change?” in all its forms. That is not an easy question, but it undoubtedly has something to do with economic freedom. Economic freedom can be defined as the absence of constraint or coercion upon those seeking to undertake an economic pursuit. Economic activity may face constraining or coercive behavior either because of direct government action or because a government permits such behavior. In other words, producers, distributors and consumers have economic freedom if they face no obstacles to their economic decisions. |
|||||||||||||||||||||||||||||||||||||||||||||||||||||||||||||||||||||||||||||
|
For example, consider Miller’s Pizzeria. Suppose the manager has found out that there is a way to improve the performance of the pizzeria’s oven, so that it can bake 10 percent faster while still producing the same quality pizza. This change will undoubtedly improve the production capability and profitability of the pizzeria. However, the adjustments to the oven require a technical team to come at great cost. If the manager is convinced that the adjustment, by itself is worthwhile, what sorts of constraints might prevent the pizzeria from making the change? |
|||||||||||||||||||||||||||||||||||||||||||||||||||||||||||||||||||||||||||||
|
Here are some possibilities: |
|||||||||||||||||||||||||||||||||||||||||||||||||||||||||||||||||||||||||||||
|
· The government taxes very profitable firms at a high rate. |
|||||||||||||||||||||||||||||||||||||||||||||||||||||||||||||||||||||||||||||
|
· The technicians are foreign and the government prevents such trade in services. |
|||||||||||||||||||||||||||||||||||||||||||||||||||||||||||||||||||||||||||||
|
· Government regulations impose a big “red tape” burden. |
|||||||||||||||||||||||||||||||||||||||||||||||||||||||||||||||||||||||||||||
|
· The government allows high officials to simply claim ownership of profitable firms for their own benefit. |
|||||||||||||||||||||||||||||||||||||||||||||||||||||||||||||||||||||||||||||
|
· Miller’s Pizzeria needs a loan to pay for the change, but the banks will only lend money to businesses approved by the government. |
|||||||||||||||||||||||||||||||||||||||||||||||||||||||||||||||||||||||||||||
|
· The local police force is corrupt and will insist on expensive bribes to allow the work to proceed. |
|||||||||||||||||||||||||||||||||||||||||||||||||||||||||||||||||||||||||||||
|
This is just a partial list - you may be able to think of some others. The point is, if something limits the economic freedom of Miller’s Pizzeria, they will be much less likely to make the sorts of changes that we would identify as technological change because the incentive to make the changes has been reduced in some way. As long as Miller’s Pizzeria could benefit from improving the speed of the oven, they have the incentive to do so. But if some obstacle exists, usually because of government interference, the incentive may disappear. |
|||||||||||||||||||||||||||||||||||||||||||||||||||||||||||||||||||||||||||||
|
So the connection works like this: increases in the standard of living over time are due to technological change. Technological change, in turn, will be more likely to occur when there is economic freedom. Thus, economic freedom and economic growth are directly related. |
|||||||||||||||||||||||||||||||||||||||||||||||||||||||||||||||||||||||||||||
|
A group called the Heritage Foundation, with the support of the Wall Street Journal, has examined the connection between economic freedom and the standard of living. They have developed a measure of economic freedom based on ten factors related to economic freedom. Here is a sampling of those factors and the important elements of each: |
|||||||||||||||||||||||||||||||||||||||||||||||||||||||||||||||||||||||||||||
|
· Trade policy: Are there tariffs and other barriers to trade? |
|||||||||||||||||||||||||||||||||||||||||||||||||||||||||||||||||||||||||||||
|
· Taxation: What are the levels of taxation for individuals and corporations? |
|||||||||||||||||||||||||||||||||||||||||||||||||||||||||||||||||||||||||||||
|
· Government intervention in the economy: Does the government own businesses? What is the size of government consumption relative to the size of the economy? |
|||||||||||||||||||||||||||||||||||||||||||||||||||||||||||||||||||||||||||||
|
· Banking: Does the government own banks? Does the government influence who gets loans? Are there other regulations? |
|||||||||||||||||||||||||||||||||||||||||||||||||||||||||||||||||||||||||||||
|
· Property rights: Is there corruption in the court system? Are there laws governing contracts? Is there protection from government or private seizure of property? |
|||||||||||||||||||||||||||||||||||||||||||||||||||||||||||||||||||||||||||||
|
For each country evaluated, the Heritage Foundation examined the ten factors and assigned a numerical value for each, based on the level of economic freedom in that area. If there was a high degree of freedom, they assigned a value of “1”. If there was no freedom, they assigned a value of “5”. For example, in Cuba the banks have very little freedom to make loans to whom they please, so Cuba received a “5” in this area (and in all others, as well). By contrast, Switzerland places very few restrictions on their banks, so they received a “1” in this area. |
|||||||||||||||||||||||||||||||||||||||||||||||||||||||||||||||||||||||||||||
|
Once all factors for all 161 countries in the study had been evaluated, the Foundation averaged the ten scores each country received in the ten areas to arrive at an overall average score of economic freedom for each country. For example, if a country scored five 2’s and five 3’s, then the overall score for economic freedom for that country would be 2.5. The table below lists the scores for several countries. The lower the score, the greater the degree of overall economic freedom in that country. |
|||||||||||||||||||||||||||||||||||||||||||||||||||||||||||||||||||||||||||||
|
|
|||||||||||||||||||||||||||||||||||||||||||||||||||||||||||||||||||||||||||||
The next thing the Foundation did was to plot each country’s measure of economic freedom and standard of living. Figure 7-5 shows the result. Each point on the graph represents a single country. Notice that there is a distinct relationship between the level of economic freedom and the standard of living for each country. The curved line demonstrates a sort of average relationship for all of the countries shown. Clearly, those countries with the highest standards of living are also the countries with higher amounts of economic freedom. In other words, the only way to make economic growth possible in the long run is to allow individuals and businesses the freedom to own property and to freely pursue those economic activities that seem best to them. When people feel secure in their freedom, they have every incentive to the best they can with the resources they have available. The result is innovative new ways of producing goods and services - what we have been calling technological change. |
|||||||||||||||||||||||||||||||||||||||||||||||||||||||||||||||||||||||||||||
|
|
|||||||||||||||||||||||||||||||||||||||||||||||||||||||||||||||||||||||||||||
To further illustrate this, let’s focus on just two countries. Let’s compare the two Koreas - North and South. Before World War II, Korea was a unified Japanese colony. At the risk of radically simplifying history, after the end of World War II, North and South Korea went different ways. Today, North Korea has a communist dictatorship, while South Korea is a democracy. The people in both countries are ethnically the same. In fact, many South Koreans have relatives in the North and vice versa. And, since they are in the same area of the world, their natural resources and climate are fairly similar. In other words, there probably aren’t two countries with so much in common, at least as far as people and location are concerned. But their economic results are vastly different. Per capita GDP in North Korea is just $900, while in South Korea it is a very healthy $13,193. In other words, the standard of living is nearly 15 times higher in the South! But if we look at the components of economic freedom, this isn’t a surprising result. |
|||||||||||||||||||||||||||||||||||||||||||||||||||||||||||||||||||||||||||||
|
North Korea is one of two countries (Cuba is the other) to receive a “5” in all ten categories. No other country in the word today, among the 161 rated, has less economic freedom. The government owns all property and tells firms what to produce. In fact, it is unlawful to own personal property in North Korea. The government controls all the banks, tells the judges how to rule in court cases, and controls all other aspects of the economy. Suppose we put Miller’s Pizzeria into this setting. Now, the government owns the shop, tells the manager how many pizzas to produce and what to pay the workers. Miller’s no longer has any incentive to improve the speed of the oven or do anything other than meet the requirement set by the government. There is very little incentive for technological change and economic growth cannot happen over time. |
|||||||||||||||||||||||||||||||||||||||||||||||||||||||||||||||||||||||||||||
|
By contrast, South Korea scored a 2.40, which falls into the “Mostly Free” range in Figure 7-5. In South Korea, not only can individuals own property, but the government does a very good job of protecting that right. South Korea scored a “1” in the area of property rights. The government does not own banks, but it does try to tell them who should receive loans. In fact, South Korea experienced a financial crisis in 1997 due to the governments increasing interference with the banking system. South Korea could also simplify the regulations that businesses must face, especially foreign firms. However, on the whole, the South Korean government has permitted a good amount of economic freedom in the last several decades. The result has been a very high rate of economic growth in most years. In fact, we are beginning to think of South Korea as one of the developed countries. |
|||||||||||||||||||||||||||||||||||||||||||||||||||||||||||||||||||||||||||||
|
How would Miller’s Pizzeria function in South Korea? Since South Korea protects property rights and there aren’t any other major obstacles to economic freedom, the manager would very likely arrange to have the oven adjusted, feeling quite certain that the pizzeria would be allowed to operate as the manager and owners saw fit. |
|||||||||||||||||||||||||||||||||||||||||||||||||||||||||||||||||||||||||||||
|
A couple of notes about the Index of Economic Freedom. First, it is not a perfect measure. These numbers are manufactured based on someone’s analysis of each country’s economic freedom. Economic freedom is very hard to quantify. No single number can fully account for the intricacies of freedom. If you reexamine Figure 7-5, you’ll notice that many of the points do not lie on or exactly near the fitted line. There must be other factors that are important, but that have not been considered. |
|||||||||||||||||||||||||||||||||||||||||||||||||||||||||||||||||||||||||||||
|
Second, a couple of the ten factors examined may not directly relate to our interest in technological change. For example, one of the factors included in this study is the rate of inflation. The higher the rate of inflation, the higher the score and the lower economic freedom rating. But inflation is directly linked to the amount of money in the economy, a very separate issue in many ways. The Heritage Foundation includes it as a factor because high inflation causes uncertainty, possibly causing businesses and consumers to postpone economic decisions. In a sense, this is a limit on economic freedom. |
|||||||||||||||||||||||||||||||||||||||||||||||||||||||||||||||||||||||||||||
|
Third, a note about some similarities among the most advanced countries in the world. The countries with the highest amounts of economic freedom, and the highest standards of living, tend to be very similar in a few of the ten categories. Almost without exception, the world’s richest economies scored well on property right protection. Perhaps more than any other factor, this is necessary for technological change. Developed economies also tended to score well on trade and banking. The barriers to trade have been slowly disappearing over the last 50 years. Most developed countries regulate banks to protect depositor rights, but tend not to interfere with banks influencing banks decisions regarding loans. |
|||||||||||||||||||||||||||||||||||||||||||||||||||||||||||||||||||||||||||||
Tying this all together |
|||||||||||||||||||||||||||||||||||||||||||||||||||||||||||||||||||||||||||||
|
In summary, we are seeing a very simple relation between growth and economic freedom: |
|||||||||||||||||||||||||||||||||||||||||||||||||||||||||||||||||||||||||||||
|
|
|||||||||||||||||||||||||||||||||||||||||||||||||||||||||||||||||||||||||||||
Lets see if we can make sense of the detailed pattern we have been observing. Figure 7-5 shows a "snapshot" of the relation between economic freedom and output. Over time, that graph can shift as the result of new discoveries. Figure 7-6 plots how the relation between economic freedom and output will change over time, by plotting the graph for both 2000 and for 2001. |
|||||||||||||||||||||||||||||||||||||||||||||||||||||||||||||||||||||||||||||
|
|
|||||||||||||||||||||||||||||||||||||||||||||||||||||||||||||||||||||||||||||
|
|||||||||||||||||||||||||||||||||||||||||||||||||||||||||||||||||||||||||||||
|
As you will note, this graph is simpler than the relation plotted by the Heritage Foundation. No one is claiming a straight line between Economic Freedom and the standard of living, but it makes for a simpler graph. As you will note, this graph also follows the pattern of the Heritage Foundation and places Economic Freedom on the vertical axis and the Standard of Living on the horizontal axis. Normally we think the independent variable belongs on the horizontal axis, but, to be consistent, we have followed the Heritage Foundation's example. |
|||||||||||||||||||||||||||||||||||||||||||||||||||||||||||||||||||||||||||||
Adjustment |
|||||||||||||||||||||||||||||||||||||||||||||||||||||||||||||||||||||||||||||
|
Let us now show how changes in economic freedom can influence economic growth. Figure 7-7 shows the initial position of two countries on the graph of economic freedom, the United States and Backwater. While the United States is at or near the top of the scale, Backwater has both a low level of economic freedom. |
|||||||||||||||||||||||||||||||||||||||||||||||||||||||||||||||||||||||||||||
|
|
|||||||||||||||||||||||||||||||||||||||||||||||||||||||||||||||||||||||||||||
|
|||||||||||||||||||||||||||||||||||||||||||||||||||||||||||||||||||||||||||||
|
Suppose now that Backwater has a political revolution. It overthrows its repressive anti-freedom regime and installs a new government, which is strongly committed to economic freedom. The government adopts tax, regulatory, and legal policies that bring its Index of Economic Freedom up to that of the United States. |
|||||||||||||||||||||||||||||||||||||||||||||||||||||||||||||||||||||||||||||
|
Over time, we would expect Backwater's standard of living to move up to that of the United States. We would not expect the adjustment to take place instantly. |
|||||||||||||||||||||||||||||||||||||||||||||||||||||||||||||||||||||||||||||
|
· The revolution will lack credibility with many people. Political revolutions promising "new eras" come and go. There must not only be economic freedom but people must believe that there is economic freedom. |
|||||||||||||||||||||||||||||||||||||||||||||||||||||||||||||||||||||||||||||
|
· The capital stock is low. The United States has a high capital labor ratio, but Backwater, if it is like most economic backwaters, has a low capital labor ratio. Just as the low level of economic freedom has kept people from making innovations, so too has it acted as a deterrent to capital investment. |
|||||||||||||||||||||||||||||||||||||||||||||||||||||||||||||||||||||||||||||
|
· Even when people begin to believe that the new era of economic freedom is here to stay, the technology takes time to acquire. The people in Backwater are not stupid, but you cannot wave a magic wand and instantly equip them with existing technology. |
|||||||||||||||||||||||||||||||||||||||||||||||||||||||||||||||||||||||||||||
|
· Finally, a significant amount of human capital is called for. It will take time for Backwater's workers to learn new skills. |
|||||||||||||||||||||||||||||||||||||||||||||||||||||||||||||||||||||||||||||
|
Intuitively, we could see all of these things taking place in Miller's Pizzeria. Suppose Miller's Pizzeria is located in Backwater. The heavy hand of government regulation and corruption has kept it from innovating. When a new government comes into power and allow the Pizzeria more freedom, changes will take place. |
|||||||||||||||||||||||||||||||||||||||||||||||||||||||||||||||||||||||||||||
|
· The owner will greet the changes cautiously. He has seen these kind of promises before. |
|||||||||||||||||||||||||||||||||||||||||||||||||||||||||||||||||||||||||||||
|
· Because of the heavy regulation, the Pizzeria is under capitalized. Its pizza ovens are something from the dark ages, it keeps its financial records on an abacus, and it hasn’t taken steps to improve its appearance, inasmuch as an improved appearance will simply attract the tax collector. All of these problems can be fixed with a capital infusion, but it will take time. |
|||||||||||||||||||||||||||||||||||||||||||||||||||||||||||||||||||||||||||||
|
· The owner has not kept abreast of new advances. Why bother? Now, he will. But it will take him time to discover new recipes for pizzas. |
|||||||||||||||||||||||||||||||||||||||||||||||||||||||||||||||||||||||||||||
|
· He cannot simply bring in the capital. His staff will require time to learn new skills. |
|||||||||||||||||||||||||||||||||||||||||||||||||||||||||||||||||||||||||||||
|
Thus, we get the pattern we have seen in many countries. Many Pacific Rim countries, for example, have adopted a high degree of economic freedom. They have experienced rapid economic growth as they catch up to the United States. |
|||||||||||||||||||||||||||||||||||||||||||||||||||||||||||||||||||||||||||||
Europe after World War II |
|||||||||||||||||||||||||||||||||||||||||||||||||||||||||||||||||||||||||||||
|
Suppose that, after having adjusted to the new economic freedom, Miller's Pizzeria has a fire. The inside of the Pizzeria is gutted. The solution is quite simple. Repair the fire damage. Call in a contractor to rebuild the inside of the Pizzeria. Order new tables, new pizza ovens, etc. It will take a little time to rebuild the restaurant. The contractor will not finish immediately. It will take time to get the new ovens working just right, and it will take some time to rebuild the clientele, which might leave during the rebuilding period. |
|||||||||||||||||||||||||||||||||||||||||||||||||||||||||||||||||||||||||||||
|
These caveats aside, we would expect the Pizzeria to rapidly recover. |
|||||||||||||||||||||||||||||||||||||||||||||||||||||||||||||||||||||||||||||
|
We saw a similar pattern of rapid recovery in Europe after World War II. People commented, for instance, on the "German Miracle". The reasons for the recovery are as obvious as that of Miller's Pizzeria. Europe had been devastated by the Second World War, but it still had the same level of technological knowledge, the same level of economic freedom, etc, as before the war. Its recovery took a bit longer than Miller's Pizzeria would have required, but the principles were just the same. All it needed to do was to rebuild its capital stock. |
|||||||||||||||||||||||||||||||||||||||||||||||||||||||||||||||||||||||||||||
The Asian Economies: A Miracle? |
|||||||||||||||||||||||||||||||||||||||||||||||||||||||||||||||||||||||||||||
|
Until very recently, many people marveled at the growth rates achieved by several Asian economies. These include South Korea (as previously discussed), Taiwan, Singapore, Hong Kong, and Japan. During the last thirty years or so, these economies have seen growth rates that are substantially higher than the US has been experiencing, causing many to wonder if the US would lose the role of the leading economy. |
|||||||||||||||||||||||||||||||||||||||||||||||||||||||||||||||||||||||||||||
|
Economists have examined these countries by first determining what has been the source of their growth. What they found is that these countries have experienced significant technological change, but much of their growth has also been due to increases in the capital stock. Does this mean that they will eventually overtake the United States? Not necessarily. These countries are catching up to the United States. It is much easier to adopt someone else’s method for increasing productivity. It is quite another matter to become technologically creative on your own. Much of what has happened in the last 30 years is that these economies have “borrowed” technology from economies with higher standards of living. To be fair, these economies are also technologically creative, but the United States still seems to lead the world in this area, especially when it comes to high tech and communication advances. |
|||||||||||||||||||||||||||||||||||||||||||||||||||||||||||||||||||||||||||||
|
Since the early 1990s, however, Japan has experienced very little economic growth. Beginning in 1997, problems have been observed in other Asian economies. The countries of Thailand, Indonesia, Korea, and Malaysia gained international attention when the international value of their currencies plummeted in late 1997, signaling that these economies were in poor health. For a while, real GDP in these economies was either stagnant or declining. Lately, however, these economies are showing signs of recovery. It even looks like Japan is finally on the road to recovery. |
|||||||||||||||||||||||||||||||||||||||||||||||||||||||||||||||||||||||||||||
|
We do not yet fully understand what caused the current situation, but two things have certainly contributed. The first is the poor health of the financial structure in each country. The banks are not financially sound, mostly because they have made bad decisions about loaning funds. Government intervention into bank decisions has been part of the problem. Second, because of the economic problems, foreign and domestic investors alike have taken their funds outside these countries for safety. Consequently, there are no funds available for business purposes. |
|||||||||||||||||||||||||||||||||||||||||||||||||||||||||||||||||||||||||||||
|
How does this affect their ability to catch-up with the developed world? If these economies fix their financial systems, they will eventually return to growth. The current problems are merely a short detour. However, this highlights an important point - economic growth is not a steady process. It has vicissitudes, but over time, we expect the ups to outweigh the downs. |
|||||||||||||||||||||||||||||||||||||||||||||||||||||||||||||||||||||||||||||
The Eastern European Economies: A Unexplainable Disaster? |
|||||||||||||||||||||||||||||||||||||||||||||||||||||||||||||||||||||||||||||
|
Another interesting group of countries is the former communist countries of Eastern Europe. About ten years ago, these economies began the transition from centrally planned economies (like North Korea and Cuba still have) to market economies. The results have been very mixed. Poland, the Czech Republic, Latvia and some others generally have been doing quite well. Others like Russia, Bulgaria, and Romania have not been doing well. What has made the difference? |
|||||||||||||||||||||||||||||||||||||||||||||||||||||||||||||||||||||||||||||
|
If we use the Index of Economic Freedom, we can begin to understand. Notice the different ratings for Poland and Bulgaria in Table 7-5. With an index number of 2.95, Poland falls into the “Mostly Free” category. Bulgaria, on the other hand, has a rating of 3.45, which is “Mostly Unfree”. This result is typical. Those countries that have been able to move the most quickly toward economic freedom are also the countries that have faired the best. Russia, the biggest of these economies, also scored a 3.45, an indication that Russia has some work to do. |
|||||||||||||||||||||||||||||||||||||||||||||||||||||||||||||||||||||||||||||
|
The problem is that the people living in these countries are weary of declining real GDP, high inflation and high unemployment. Some are calling for a return to the old system of central planning. The real problem, however, is that these economies have yet to establish a free enterprise system. They place burdensome restrictions on trade, do not fully protect property rights, and interfere with the financial system. Free enterprise hasn’t failed in Eastern Europe - it hasn’t yet been attempted for many nations. |
|||||||||||||||||||||||||||||||||||||||||||||||||||||||||||||||||||||||||||||
Summary |
|||||||||||||||||||||||||||||||||||||||||||||||||||||||||||||||||||||||||||||
|
Let us summarize what we have learned about economic growth. |
|||||||||||||||||||||||||||||||||||||||||||||||||||||||||||||||||||||||||||||
|
· A nation's productivity depends on Technology, Labor and Capital. |
|||||||||||||||||||||||||||||||||||||||||||||||||||||||||||||||||||||||||||||
|
· Technological change and innovation can occur in a nation that meets the preconditions for economic growth. The key precondition is economic freedom, protection of property rights. |
|||||||||||||||||||||||||||||||||||||||||||||||||||||||||||||||||||||||||||||
|
· A nation that removes barriers to economic freedom will, in time, "catch up" with the more prosperous countries of the world. However, the process of catching up will not be instantaneous. Among other reasons, capital accumulation, both physical and human, takes time. |
|||||||||||||||||||||||||||||||||||||||||||||||||||||||||||||||||||||||||||||
|
· A nation that suffers the ravages of a war will "catch up" with its pre-war peers. However, the process of catching up will not be instantaneous. Among other reasons, capital accumulation takes time. |
|||||||||||||||||||||||||||||||||||||||||||||||||||||||||||||||||||||||||||||
Relation to the Text |
|||||||||||||||||||||||||||||||||||||||||||||||||||||||||||||||||||||||||||||
|
Each of these lectures ends with a section relating it to the text. The lecture notes are divided into a number of individual lecture notes, generally in the same order as the chapters in the text. They do not repeat the text word for word. In some cases, material is omitted, either because the text covers it well enough or because it is not worth learning. In other cases, material is added. Each of these “lectures” will end with a brief note relating the lecture to the text, describing what material is left to the student to learn alone and what material may safely be skipped. |
|||||||||||||||||||||||||||||||||||||||||||||||||||||||||||||||||||||||||||||
Which Chapters does this lecture cover? |
|||||||||||||||||||||||||||||||||||||||||||||||||||||||||||||||||||||||||||||
|
|
|||||||||||||||||||||||||||||||||||||||||||||||||||||||||||||||||||||||||||||
Stockman introduces a new model in this chapter. This lecture ignores that model and instead uses the same model developed in lecture 3 of these notes (Chapter 7 in Stockman). |
|||||||||||||||||||||||||||||||||||||||||||||||||||||||||||||||||||||||||||||
What material is new? |
|||||||||||||||||||||||||||||||||||||||||||||||||||||||||||||||||||||||||||||
|
This lecture includes additional historical material not covered in the book. |
|||||||||||||||||||||||||||||||||||||||||||||||||||||||||||||||||||||||||||||
|
©2000 by
Greg Chase and Charles W. Upton. If
youare enrolled in Principles of Macroeconomics at Kent State University, you
may print out one copy for use in class.
All other rights are reserved. |
|||||||||||||||||||||||||||||||||||||||||||||||||||||||||||||||||||||||||||||