Equatorial Currents and El Niño
The tropical Pacific oscillates between El Niño and La Niña. This is the El Niño Southern Oscillation ENSO. The variability of conditions in the tropical Pacific was first noticed by the meteorologist Sir Gilbert Walker in the early decades of the 20th century. He found that that pressure fluctuations throughout that equatorial Pacific are highly correlated with pressure fluctuations in many other regions of the world. He found that the two strongest centers of the variability are near Darwin, Australia and Tahiti. The fluctuations at Darwin are opposite those at Tahiti, and resemble an oscillation. Furthermore, the two centers had strong correlations with pressure in areas far from the Pacific. Walker named the fluctuations the Southern Oscillation. Later, oceanographers noticed that the warming off the west coast of South America, which they called the El Niño, was just another manifestation of ENSO. Now El Niño is often referred to as the El Niño Southern Oscillation, or ENSO.
Definition
El Niño is a disruption of the ocean-atmosphere system in the tropical Pacific having important consequences for weather and climate around the globe.
NOAA.
The more exact technical definition used by NOAA is:
- El Niño is the phenomenon in the equatorial Pacific Ocean characterized by a positive sea-surface temperature departure from normal (for the 1971-2000 base period) in the region 5°N – 5°S, 120°W – 170°W greater than or equal in magnitude to 0.5 degrees C, averaged over three consecutive months.
- La Niña is the phenomenon in the equatorial Pacific Ocean characterized by a negative sea-surface temperature departure from normal (for the 1971-2000 base period) in region 5°N – 5°S, 120°W – 170°W greater than or equal in magnitude to 0.5 degrees C, averaged over three consecutive months.
These definitions were adopted by the US and 25 other countries in North and Central America and the Caribbean in April 2005.
What Happens During ENSO?
The best description of the El Niño/La Niña cycle is found on the El Niño Theme Page web page published by the NOAA Pacific Marine Environmental Laboratory. Here is a brief summary.
During La Niña
Strong trade winds push water on the equator westward, piling it up against Asia. The warm water in the west Pacific warm pool fuels convection in the atmosphere, which leads to rain warming the atmosphere when latent heat is released. The heating drives a convective loop, the Walker Circulation, which helps maintain the trade winds. The convection is also a major driver of the global atmospheric circulation and the Hadley Cell.
La Nina conditions in the Pacific with strong trade winds (black arrows) pushing surface water toward the west (white arrows) and heavy rain in the west driving the atmospheric circulation (black arrows). Colors give temperature of the ocean surface, red is hottest, blue is coldest.
From: NOAA Pacific Marine Environmental Laboratory.
In the west:
- Sea surface temperatures are warm,
- Air pressure is low, and trade winds blow strongly from the east,
- The pool of warm water is deep, and
- Heavy rain falls in the far western tropical Pacific and over New Guinea and northern Australia.
Average rain rate in January 2000 measured by the Tropical Rain Measuring Mission satellite. Click on the image for a zoom.
From Tropical Rain Measuring Mission office at the NASA Goddard Space Flight Center.
In the east:
- Sea surface temperatures are cold on the equator,
- Air pressure is high,
- The atmosphere is very stable, and
- Coastal areas of Peru and Ecuador are cool and dry with stratus clouds.
End of La Niña
The end is not predictable. La Niña ends when trade winds
weaken and warm water begins to surge toward South America from the western
equatorial Pacific. The trade winds can weaken due to changes in weather — the
trade winds are not perfectly constant. Or they may weaken due to cyclones
just north and south of the equatorial region. Typically, the switch
occurs after La Niña has been in force for several years and heat
has built up in the western Pacific. Whatever the cause, when the trade
winds weaken and stay weak, the eastern equatorial Pacific warms, further
reducing the trades, and the Pacific switches to El Niño.
A complete El Niño cycle results in a net heat discharge from the tropical Pacific toward higher latitudes. At the end of the cycle the tropical Pacific is depleted of heat, which can only be restored by the slow accumulation of warm water in the western Pacific by normal trade winds. Consequently, the time scale of the Southern Oscillation is given by the time required for the accumulation of warm water in the western Pacific. Its release is triggered by fluctuations in the tropical atmosphere.
Klaus Wyrtki 1985.
During El Niño
When the trade winds weaken, or reverse in the west, the warm water can surge eastward on the equator, moving the eastern edge of the warm pool toward the central equatorial Pacific, the red area in the image above. The rain follows the warm water eastward. Because rain heats the atmosphere and drives the atmospheric circulation, the main heat source driving the atmospheric circulation moves eastward. As the heat source (the rain) moves eastward toward the central equatorial Pacific, changes in the convection weakens the trade winds in the east, leading to a strengthening of the El Niño conditions.
El Niño conditions in the Pacific with weak or reversed trade winds in the west (black arrows) allowing surface water to surge eastward (white arrows) and with heavy rain in the central equatorial Pacific driving the atmospheric circulation (black arrows). Colors give temperature of the ocean surface, red is hottest, blue is coldest.
From: NOAA Pacific Marine Environmental Laboratory.
In the west,
- The pool of warm water is shallower.
- Air pressure is low, and trade winds are weak, or sometimes reversed.
- Warm sea-surface temperatures extend far into the central equatorial Pacific.
- Heavy rain falls in the central and eastern tropical Pacific.
- Little rain falls on New Guinea and northern Australia.
Average rain rate in January 1998, an El Niño year, measured by the Tropical Rain Measuring Mission satellite. Notice that the rain has shifted from the western Pacific and eastern Indian ocean to the central Pacific. Click on the image for a zoom.
From Tropical Rain Measuring Mission office at the NASA Goddard Space Flight Center.
In the east,
- Sea surface temperatures are warm, up to 3°C warmer than normal,
- Air pressure is low,
- The atmosphere is warm and unstable, and
- Rain falls on coastal areas of Peru and Ecuador.
Warm water surges up the east and west coasts of the Americas, leading to above average rains in California.
Sea-surface temperature anomalies during the strong 1997 El Niño. Note the warm temperatures along the west coasts of the Americas. Click on image for a zoom.
From US Navy Fleet Numerical Meteorological and Oceanography Center.
End of El Niño
The end is not predictable. El Niño ends when atmospheric conditions
lead to a strengthening of the trade winds, usually after El Niño
was in effect for about a year. The strengthening may be due to just
the random changes in the weather — the trade winds do not stay
permanently weak. Or it may be due to tropical disturbances moving eastward
out of the Indian Ocean. Or, it may be due to disturbances in the equatorial
currents, reflecting off South America and Asia, returning to the central
Pacific. Whatever the cause of the strengthening of the trades, they
begin to push warm water back toward Asia. Rain follows the warm water,
the Walker Circulation strengthens, further weakening El Niño.
Soon, within a month or two, the circulation switches toward La Niña
conditions.
An El Niño Animation
The NOAA Climate Diagnostics Center has an online Animation Of An Idealized El Niño/La Niña Cycle in the Pacific showing anomalies of sea-surface height (the grid in the animation) and anomalies of sea-surface temperature (the color of the grid). The weakening of trades in the western equatorial Pacific causes warm water in the upper layer of the equatorial region to move eastward, leading to higher sea level and warmer water in the eastern equatorial Pacific. The wave of higher sea level (called a Kelvin wave) reflects off South America, and returns to the west at latitudes north and south of the equator.
El Niño animation of anomalies of sea-surface height (vertical scale, in centimeters) and anomalies of sea-surface temperature (color scale in degrees Celsius) in the tropical Pacific during an idealized El Niño/La Niña cycle.
Produced by Joe Barsugli at the NOAA Cooperative Institute For Research In Environmental Sciences.
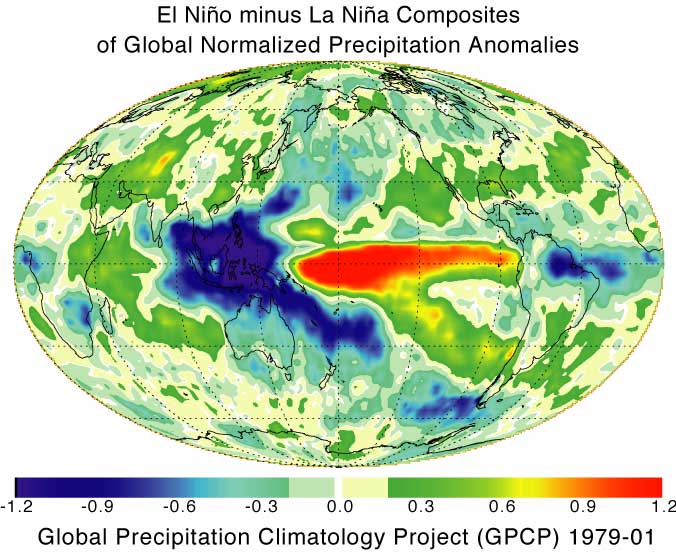
Changes in Rainfall During ENSO
As surface temperature patterns change at the sea surface, rain patterns also change. Rain tends to stay centered over the warmest water. Below is an image showing the difference in rain patterns in the Pacific in El Niño years compared with La Niña years.
This plot shows the change in rainfall in the Pacific during a typical El Niño year compared with a typical La Nina year using all data from 1979 to 2001 collected by the Global Precipitation Climatology Project by Scott Curtis and Robert Adler. Notice that the area of high rainfall in the equatorial Pacific shifts eastward by more than 65° during an El Niño event. Thus the major heat source for driving the atmospheric circulation also shifts east, causing rain elsewhere around the world to change.
From Curtis and Adler (2002), for more information read Curtis and Adler (2003).
Not All El Niños Are The Same
El Niño can be strong or weak. Some have small changes in water temperature in the eastern Equatorial Pacific, but heavy rains in the central tropical Pacific, others have larger changes in temperature with less of a change in rain. The El Niños of 1981–1982 and 1997–1998 were very strong, sometimes called the El Niños of the century. The El Niño of 1957–1958 had weaker temperature anomalies than the El Niño of 1972–1973, but it produced much large changes of weather patterns. The El Niño of 1976–1977 was weak. The El Niños of 1982–1983 and 1997–1998 were strong.
The NOAA Climate Prediction Center publishes a table of the Oceanic Niño Index starting in 1950 showing the anomaly of sea-surface temperature in the area 5°N – 5°S, 120° – 170°W). Cold temperature in blue indicates a La Niña, red indicates an El Niño. The larger the anomaly, the larger the influence of the Pacific on global weather patterns.
El Niño Multivariate Index since 1950 showing the variability of El Niño/La Niña. The index is based on sea-level pressure, zonal (east-west) and meridional( north-south) components of the surface wind, sea-surface temperature, surface air temperature, and total cloudiness fraction of the sky, all for the tropical Pacific. Red is El Niño, blue is La Niña.
From NOAA/Climate Analysis Branch Multivariate ENSO Index (MEI) web page.

Work by Kim, Webster, and Curry (2009) shows that there are three two different patterns or warming and rainfall during El Niño, and the three patterns have very different influence on Atlantic hurricanes. The three patterns are based on sea-surface temperature anomaly for August to October in the Niño 4, Niño 3.4 and Niño 3 regions.
Definition of the three regions of the equatorial Pacific important for monitoring El Niño.
From Jan Null, Certified Consulting Meteorologist, Golden Gate Weather Services.
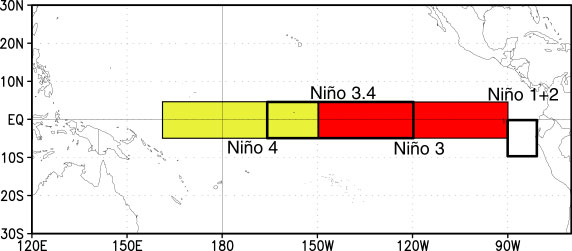
- EPC– East Pacific Cooling pattern occurs when the temperature anomaly is colder than one standard deviation in the Niño 3 region (90ªW – 150ª W and 5ªS – 5ªN) or in the Niño 3.4 region (120ªW – 170ªW and 5ªS – 5ªN). This is similar to a La Niña event.
- EPW– East Pacific Warming pattern occurs when the temperature anomaly is warmer than one standard deviation in the region Niño 3 region (90ªW – 150ª W and 5ªS – 5ªN). This is an El Niño event.
- CPW– Central Pacific Warming pattern occurs when temperature anomaly is warmer than one standard deviation in the Niño 4 region region (160ªE – 150ªW and 5ªS – 5ªN) while the temperature anomaly in the region Niño 3 region does not get this warm. This could be considered a weak El Niño.
The three patterns have very different effect on the tracks of tropical cyclones in the Atlantic.
Density of tropical cyclone tracks during the period 1950 to 2006 for three patterns of sea-surface temperature in the equatorial Pacific. EPW– East Pacific Warm pattern, CPW– Central Pacific Warm pattern, and EPC– East Pacific Cold pattern. Blue shades indicate fewer than normal cyclones in the region, red shades indicate more cyclones than normal. Areas inside white contours are statistically significant at the 90% level. Areas inside the dark contours are statistically significant at the 95% level. Click on the image for a zoom that shows the land areas more clearly.
From Kim et al (2009).
_F2.jpeg)
Additional Information
- NOAA's Physical Sciences Division map room has the latest maps of sea-surface temperature and temperature anomalies.
- NOAA Educational Resources.
References
Curtis, S. and R. Adler (2002). ENSO Related Precipitation Anomalies from the Tropics to the Extratropics. CLIVAR Exchanges 7 (1): 8–9, 13.
Curtis, S. and R. F. Adler (2003). Evolution of El Niño-precipitation relationships from satellites and gauges. Journal of Geophysical Research 108 (D4): 9-1 – 9.8.
Kim, H.-M., P. J. Webster, et al. (2009). Impact of Shifting Patterns
of Pacific Ocean Warming on North Atlantic Tropical Cyclones. Science 325
(5936): 77–80.
Two distinctly different forms of tropical Pacific Ocean warming are
shown to have substantially different impacts on the frequency and tracks
of North Atlantic tropical cyclones. The eastern Pacific warming (EPW)
is identical to that of the conventional El Niño, whereas the
central Pacific warming (CPW) has maximum temperature anomalies located
near the dateline. In contrast to EPW events, CPW episodes are associated
with a greater-than-average frequency and increasing landfall potential
along the Gulf of Mexico coast and Central America. Differences are shown
to be associated with the modulation of vertical wind shear in the main
development region forced by differential teleconnection patterns emanating
from the Pacific. The CPW is more predictable than the EPW, potentially
increasing the predictability of cyclones on seasonal time scales.
Trenberth K.E. (1997). The definition of El Niño. Bulletin of the American Meteorological Society 78 (12): 2771–2777.
Revised on: 29 May, 2017