
What is the Evidence for Global Warming?
Carbon dioxide concentration in the atmosphere measured by David Keeling and colleagues at Mauna Loa, Hawai'i and from polar ice cores, with average global surface temperature of earth.
Image from Woods Hole Research Center, presentation by Director John P. Holdren, The Scientific Evidence.
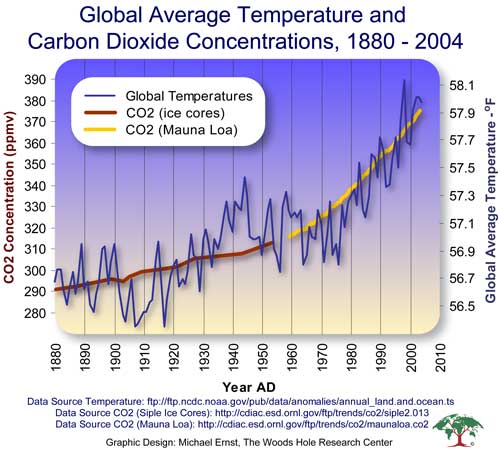
The plot above, which we saw in the last chapter, shows that earth surface is warming. Now let's look at the evidence used to make the plot.
- Where do we get our information?
- How do we know if the ocean or land temperatures are changing?
- What is the evidence?
- How good is the evidence?
Where do we get our information?
- On land, temperature is measured a
hundreds of weather stations, somewhat unevenly distributed around the
world, and on some oceanic islands.
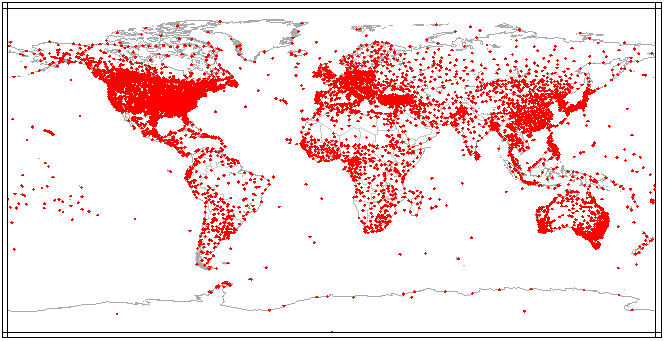
Map of land stations in the Global Historical Climatology Network where air temperature was measured on land and islands. From: NOAA National Climate Data Center.
- At sea, we get data from satellites and from ships. Satellite measurements of surface temperature come primarily from the Advanced Very High Resolution Radiometer (AVHRR) first launched in 1978 and operated continuously since then. The satellite data are calibrated using ship observations of surface temperature from the same time and place. Accuracy of the combined ship and satellite data set, the Reynolds Optimum Interpolation Sea-Surface Temperature maps is about +- 0.3 degrees C on a one-degree (horizontal) grid.
- Data from the AVHRR
are available with horizontal resolution of about 1 km. Such maps
show much more detail than the Reynolds maps. For example, look
at a map of sea-surface
temperature in the Gulf of Mexico produced by the Johns Hopkins
University Applied Physics Laboratory, Ocean
Remote Sensing Group. Click on a few of the thumbnails
to bring up the image.
- How was the map made?
- What problems might we have if we tried to determine average temperature of the ocean before satellites were available, by using data from ships?
- To learn more, look at the sample images of the Gulf Stream.
-
Before 1978, all observations at sea were made from ships using thermometers to measure water samples collected in buckets (bucket temperature) or to measure water drawn into the ship to cool the engines (injection temperature). Approximately 185,000,000 observations have been collected, evaluated, and tabulated through the International Comprehensive Ocean Atmosphere Data Set (ICOADS) for the period 1784 to 2002. The data set is the monthly summaries of the observations. The monthly time series are available at 2-degree (1800-2002) and 1-degree (1960-2002) spatial resolutions. Very few observations are available before about 1850, and most are from 1900.
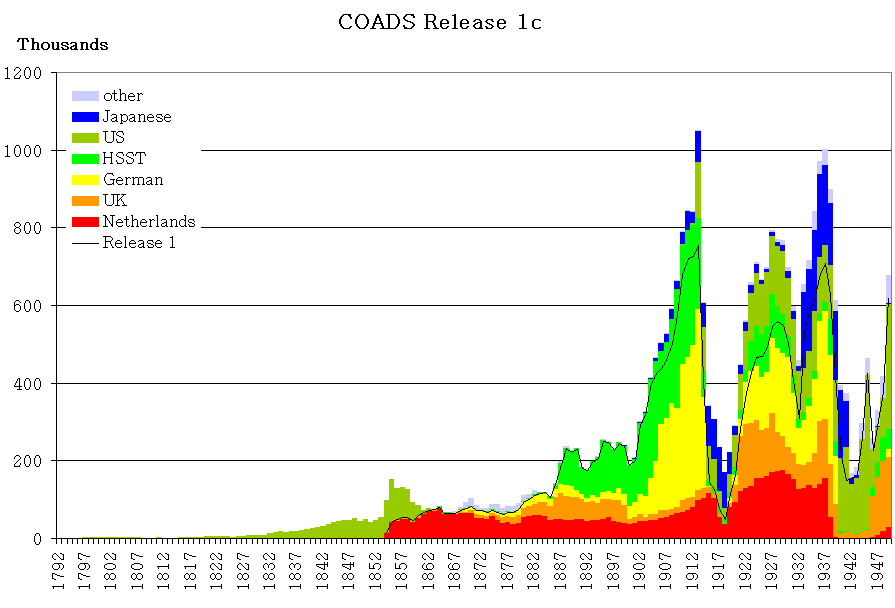
Number of reports of marine weather reports each year included in the International Comprehensive Ocean-Atmosphere Data Set (From NOAA Climate Diagnostics Center).
Number of reports of marine weather reports each year included in the International Comprehensive Ocean-Atmosphere Data Set in the period 1936 to 2005 in release 2.3 of the data set. Click on the image for a zoom.
From International ICOADS.
For more information on measurements of water and air temperature at sea read the page on measurements of sea surface temperature in Climate Change 2001: The Scientific Basis by the Intergovernmental Panel on Climate Change.
Sources of error.
Several sources contribute errors to the plot of earth's surface
temperature temperature.
- One important error is due to the large variability in the the land and ocean temperature from region to region and month to month. Temperatures on land vary up to approximately 15-20 degrees C during the day at mid latitudes, and by up to approximately 50 degrees C from summer to winter. Over the oceans, the range is much smaller, approximately 7 degrees C from summer to winter.
- The biggest error in the calculation is called the sampling error. We do not have enough measurements to determine if temperature is changing before about 1850, and we barely have enough even today. The error leads to some the year-to-year variability in the plot of global averaged surface temperature as as a function of time.
- Smith and Reynolds report that the 95% confidence uncertainty
for the near-global average is 0.48C or more in the nineteenth century,
near
0.28C for the first half of the twentieth century, and 0.18C or less
after 1950.
Global average of sea-surface temperature calculated using Smith and Reynolds techniques, with edtimates of errors in the values.
From NOAA National Climate Data Center Climate 2005 Annual Report.
- Instruments have some error. For example, water in buckets made of canvas used from 1900 to 1940 cooled off quickly compared with water in wooden buckets used before 1900. This introduced systematic, small errors into global averages of sea-surface temperature. See Box 2.2: Adjustments and Corrections to Marine Observations in measurements of sea surface temperature and ocean air temperature in Climate Change 2001.
- The urban heat island effect. Most measurements on land are made near cities. As cities grow, they heat the atmosphere over and near the city. This heating is due to the city, not to global warming. About 50% of the warming in the US may be due to heat islands and land use changes (Kalnay, 2003).
Evidence from the past 400,000 years.
The instrumental record based on direct measurements of temperature made by thermometers and satellite instruments goes back only a hundred and fifty years. To learn about more about earlier climate change we need to use proxy data, measurements of phenomena that depend on climate. Various types of proxy data are used:
- Cores of the sea floor made by the Integrated
Ocean Drilling Program IODP. For example, Expeditions
303 and 306 collected data on climate variability in the North
Atlantic over tha past few million years. The data is used with
data cores from the Greenland Ice Sheet.
Location of proposed drill sites. Blue circles = primary sites planned for Expedition 303, red circles = primary sites planned for Expedition 306, and open circles = alternate sites. From Expeditions 303 and 306 Scientific Prospectus, Introduction.
- Ice cores from
thick ice sheets in Greenland,
Antarctica,
and mountain glaciers from around
the world provide many different
types of data:
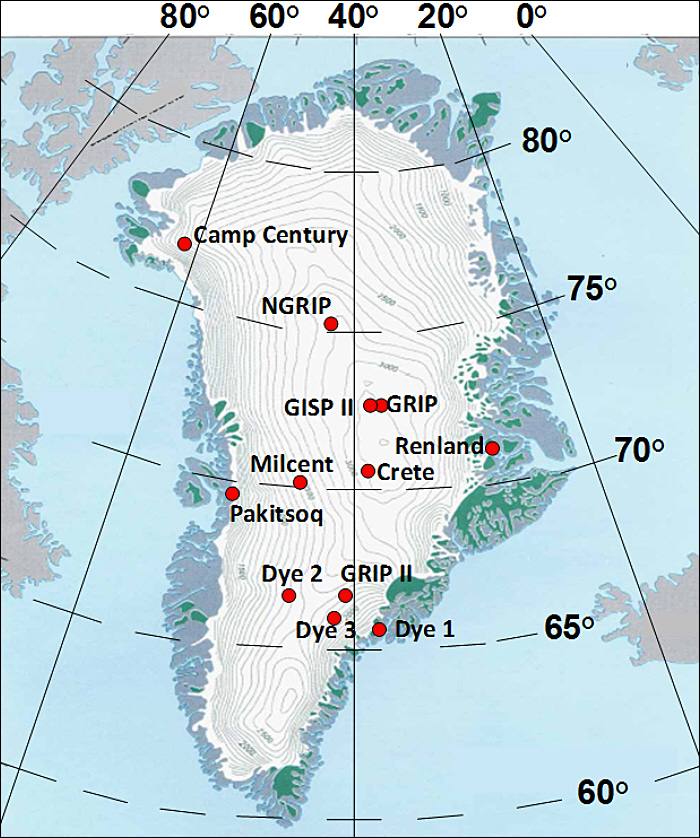
Location of Greenland ice cores. From Carbon Dioxide InformationAnalysis Center.
-fig.gif)
Photo of an ice core. From Kennedy (2006).
- The layers give the age of the ice. For the latest ten thousand
years of longer, counting the layers gives age.
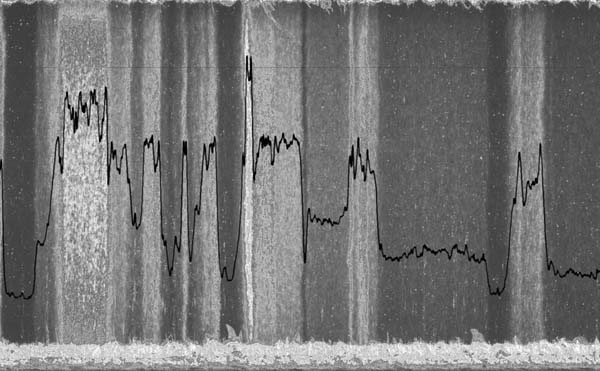
Here is a photo of ice in a core collected by from the North Greenland Ice Core Project showing annual layers of the ice from about 1800 m depth, which means the ice is about 20 000 years old.The curve shows the variations in light intensity measured by a line scanner showing the light intensity scattered from the ice. This picture will be a part of Søren Wedel Nielsen's Master's Thesis. From North Greenland Ice core Project, photos from 2001.
- Stable isotopic composition, especially the ratio (18O/16O) where 18O is the concentration of the oxygen 18 isotope, and 16O is the concentration of oxygen 16 isotope, and the concentration of duterium. The oxygen isotope ratio and the duterium concentration give the temperature at which H2O condensed as water or snow on the surface of the ice sheet.
- Air bubbles trapped in the ice gives atmospheric gas content, especially the concentration of carbon dioxide.
- Dust content in the ice depends on windiness over land upwind of the ice sheet.
- Salt content in the ice depends on windiness over the ocean upwind of the ice sheet.
- Sulphuric acid content of the ice depends on volcanic activity.
- The layers give the age of the ice. For the latest ten thousand
years of longer, counting the layers gives age.
- Dendrochronology uses measurements of the width of tree rings to determine relative changes in environmental conditions influencing the growth of trees. Change sin width provide information on droughts and temperature changes. See also dendrochronology at the Minnesota State University's E-Museum.
- Analysis of pollen deposited in layered sediments in lakes gives the type of plants growing in the vicinity of the lake at different times. Types of plants depends on climate, and their types and abundance give information about past climates.
- Look at the data and how data are collected at NOAA's Paleoclimate web site.
- Then read the Paleoclimate Data for the Last 1000 Years.
See also Temperature Trends at Selected Stations.
Reference
Kalnay, E. and M. Cai (2003). Impact of urbanization and land-use change on climate. Nature 423: 528–531.
Kennedy, D. and B. Hanson (2006). "Ice and History." Science 311 (5768): 1673.
Stokstad gives a good overview of the ways to reconstruct paleoclimate.
Stokstad, E. (2001). PALEOCLIMATE: Myriad Ways to Reconstruct Past
Climate. Science 292 (5517): 658–659.
Revised on: 30 May, 2017