Forecasting El Niño
Because El Niño has such a large effect of weather patterns, many wish to forecast its coming. Two approaches are used: Statistical Models and Dynamical Models. Both seem to be equally accurate (or inaccurate).
Statistical Models
Statistical models are based on an analysis of weather patterns in the Pacific using data going back many decades. The basic idea is that if ocean and weather patterns today are similar to patterns at some time in the past, then today's patterns will evolve as they did at that past time. For example, if winds and temperatures in the tropical Pacific today are similar to wind and temperature just before the 1976 El Niño, then we might expect a similar El Niño to start in the near future. Of course one year is never just like any previous year, and the forecast may not be correct.
The difficulty lies in deciding what conditions are important: water temperature, cloudiness, air pressure, winds, or what? The best forecast models are based on a careful selection of weighted averages of key variables that are found to give good forecasts. One statistical method, the canonical correlation analysis (Barnston and Ropelewski, 1992), is based on nearly global sea level pressure and sea-surface temperature in the equatorial Pacific for the three months preceding the forecast. Other models, including the Markov model of Xue et al (2000), are based on different variables and time periods.
Dynamical Models
Dynamical models are based on coupled ocean-atmosphere numerical models that include information about the present state of the Pacific and the the dynamic of the ocean and atmosphere. For example, take January 2008 conditions, put them into a numerical model of the coupled ocean and atmosphere in the tropical Pacific, and run the model forward in time. This is the same approach that is used to forecast weather. The conditions used by the model include currents, temperature, and salinity at different depths near the surface in the Pacific plus temperature and pressure in the atmosphere.
Results
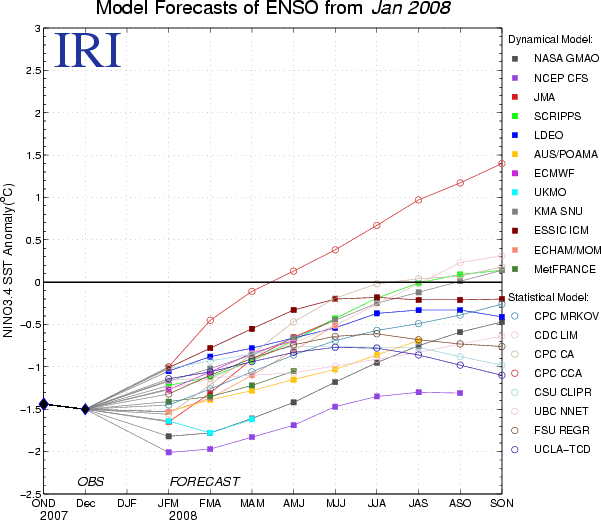
The many different forecasts by many different groups rarely agree. Typically there is some tendency toward agreement but with considerable disagreement. Here is an example from January 2008 showing all forecasts of temperature anomalies in the eastern equatorial Pacific, including 8 statistical models and 12 dynamical models.
Summary of forecasts of the temperature anomaly in the eastern equatorial Pacific (nino 3.4 area lat 5°S to 5°N, long 170°W to 120°W) made in December 2007. Notice that the forecasts tend to predict a weak La Niña in summer 2008, and that the forecasts differ, ranging from a weak El Niño to a strong La Niña.
From Climate Diagnostics Bulletin (January 2008), published by the NOAA Climate Prediction Center from information provided by the International Research Institute for Climate and Society (IRI).
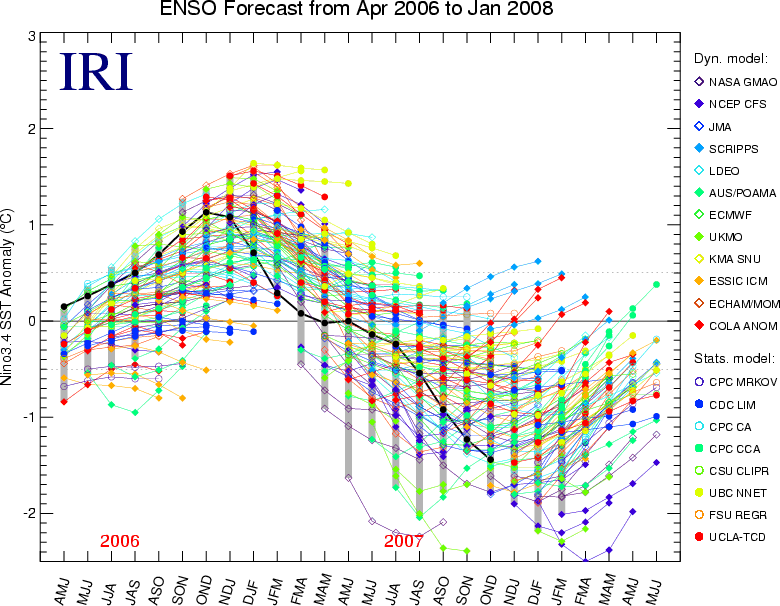
Range of all forecasts from April 2006 to January 2008. The start for each set of curves is the forecast for that month made the previous month. An interactive web page showing forecasts of one model at a time highlighted against a background of more lightly colored lines for all other models is provided by the International Research Institute for Climate and Society.
From International Research Institute for Climate and Society.
Today's Forecasts
Forecasts of El Niño and its influence on weather patterns are available from several sources.
- Climate
Diagnostics Bulletin of the NOAA National Centers for Environmental
Prediction contains a complete summary of present conditions and forecasts.
- Tropical Highlights summarizes the current conditions in the tropical Pacific.
- The forecast is contained in the Forecast section of the Bulletin.
- Current Forecast page from NOAA provides weekly updates to the Climate Diagnostics Bulletin.
- Seasonal ENSO Outlook provides a more detailed look at the forecast from the coupled model.
- The official seasonal forecasts for temperature and precipitation for the continental US are at the Seasonal Outlooks page of NOAA's Climate Prediction Center.
- Other forecasts for the Continental US are at Climate Prediction Center.
References
Barnston, A. G. and C. F. Ropelewski (1992). Prediction of ENSO Episodes Using Canonical Correlation Analysis. Journal of Climate 5 (11): 1316–1345.
Xue, Y., A. Leetmaa, et al. (2000). "ENSO Prediction with Markov
Models: The Impact of Sea Level." Journal of Climate 13(4): 849-871.
Revised on: 16 July, 2009


