
El Niño and Tropical Heat
The Big Picture
The story of El Niño and La Niña begins in the tropical Pacific.
- The Pacific is big. At the equator, it extends from Ecuador in the east to the west coast of Sumatra in the west, a distance of about 176 degrees of longitude, or about halfway around the earth.
- So much sunlight (solar heat) reaches the Pacific, that it provides a large portion of the heat needed to drive the circulation of the atmosphere. The tropical Pacific ocean and atmosphere are a giant heat engine that converts solar energy into kinetic energy of the winds.
- Thus any small changes in the interaction of the ocean and atmosphere in the Pacific must have important consequences.
- We call these perturbations in the air-sea interaction of the Pacific El Niño/La Niña or the El Niño Southern Oscillation ENSO.
The Flow of Heat From the Sun to the Ocean to the Atmosphere in the Tropics
Let's begin our study of the interaction of the ocean and atmosphere in the Pacific with a look at the heat budget of the region.
- The Pacific is heated by incoming solar radiation (sunlight),
called insolation. Look at this plot
of the average surface insolation calculated by the Centre
for Medium Range Weather Forecasting (ECMWF) using 40 years of
meteorological data. Notice that the heating exceeds 250 W/m2 over
much of the equatorial Pacific.
- The heat gained by the Pacific must be balanced by a heat loss
of the same size, otherwise the Pacific would warm or cool. Heat
gain must equal heat loss averaged over a few years.
- The ocean loses heat by:
- Evaporation,
- Emitting infrared radiation (energy),
- Direct conduction to the atmosphere, or
- Transporting heat away by currents.
- In the tropical Pacific, evaporation, called latent heat flux
dominates with a much smaller loss by infrared radiation (energy).
- Look at these plots of latent heat flux and
- infrared heat flux from the ECMWF. Infrared loss is small because there is so much water vapor in the tropical atmosphere that little infrared radiation can escape the surface. Downward radiation nearly equaly upward radiation.
- Notice that evaporation loss is greatest, and infrared is much smaller, and that together they account for a net loss of about 150 W/m2. The net heat flux is shown in this map from the ECMWF. Net heat flux is downward, and varies from 30 to 150 Watts per square meter along the equator, with the highest heating in the east.
- Currents
carry most of the remainder, mostly from the eastern
tropical Pacific to the west and to slightly higher latitudes.
- Currents are very important.
They determine the distribution of surface temperature which strongly
influences atmospheric winds and convection.
- Look at these maps of mean surface temperature in January and July.
- Notice that the eastern equatorial Pacific is much cooler than the western equatorial Pacific, although the eastern area gets more net heat.
- Trade winds blowing westward along the equator cause upwelling
on the equator. In the east, the upwelling brings up cold
water, which is close to the surface. In the west, the upwelling
brings up warm water because cold water is much deeper below
the surface. The heat gained in the east is partly lost by
mixing with cold upwelled water, and partly transported to
the west by equatorial currents.
Average January temperatures as a function of depth along the Equator in the Pacific. Click on the image for a zoom.
Map from Pacific Marine Environmental Laboratory of NOAA, Seattle.
- The latent and infrared heat lost by the tropical Pacific warms
the atmosphere.
- The infrared radiation (energy) is mostly absorbed by water vapor in the air, water vapor being a greenhouse. And the water vapor comes from the ocean when heat is lost through evaporation.
- Water vapor evaporated from the sea is carried by the
trade winds into the Inter Tropical Convergence Zone (ITCZ).
In the convergence zone the rises and cools, water vapor
condenses, releasing the latent heat, and falls as rain.
Each kilogram of rain releases 2.5 million joules of heat.
The heat warms the air relative to other air at the same
height in the atmosphere, which causes convection, which
draws in more water vapor from the trade winds, which drives
the trade winds and the Hadley
circulation of the atmosphere.
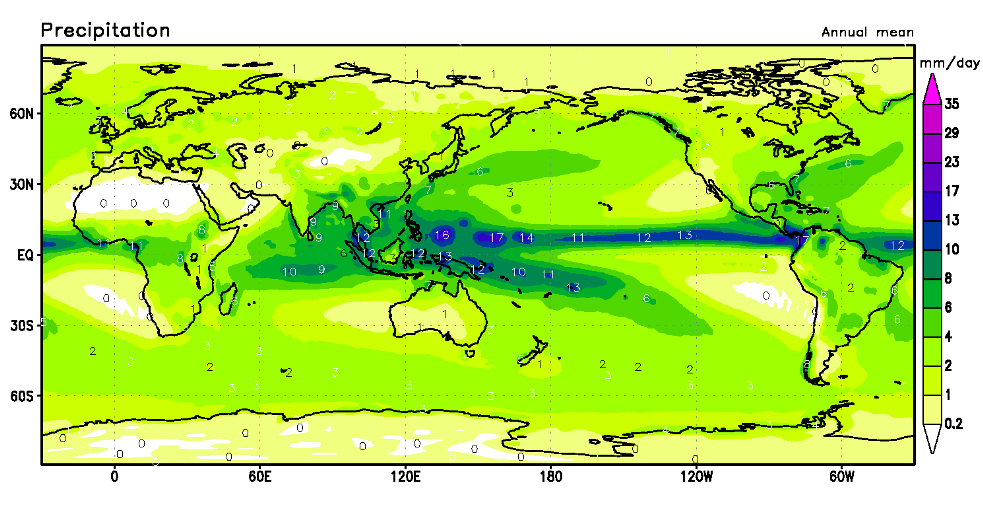
- Where is the rain? How much is available to drive the atmosphere? What happens in the atmosphere?
Global map of rain rate averaged averaged over the 25-year period from 1979 to 2004. The band of heavy rain just north of the equator is the Intertropical Convergence Zone. Click on the map for a zoom.
From Japanese 25-year Reanalysis of atmospheric data.
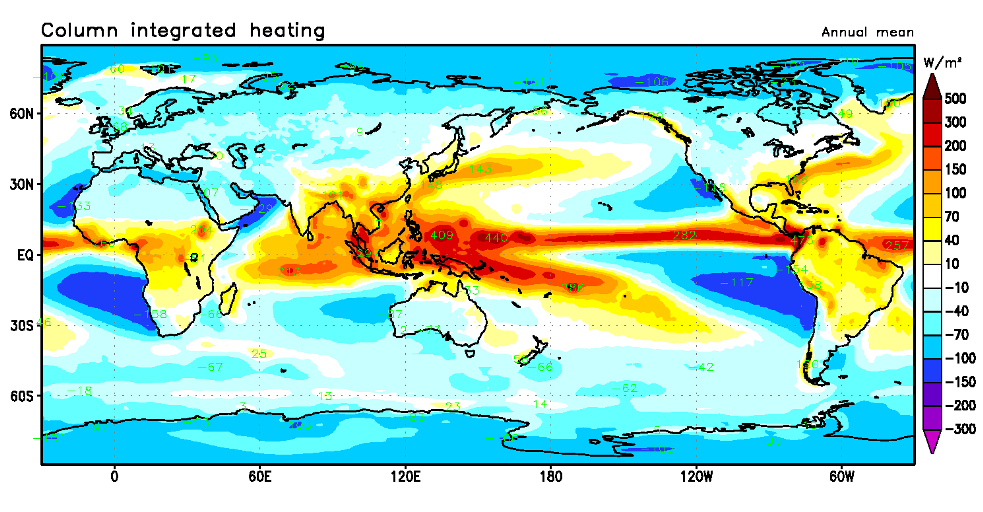
Rain releases latent heat, warming the atmosphere. Here is where the atmosphere is heated.
Global map of heating of the atmosphere from the surface to space (column integrated heating) averaged over the 25-year period from 1979 to 2004. Notice that areas of heavy rain coincide with areas of high heating. The atmosphere is heated mostly by the release of latent heat by rain. Click on the map for a zoom.
From Japanese 25-year Reanalysis of atmospheric data.
Revised on: 30 May, 2017