
Content
Observing the Tropical Pacific
The Pacific is large, yet several systems are now making routine measurements of the tropical Pacific, returning data useful for monitoring the air-sea interactions over such a large area. Three types of systems are being used.
Moored Instruments
The most important set of moored instruments is the Tropical Atmosphere Ocean (TAO) Array managed by the NOAA Pacific Marine Environmental Laboratory's Tropical Atmosphere Ocean Project. The project manages an array of moorings in the tropical Pacific that send back measurements of wind velocity, water and air temperature, relative humidity, rain, solar and infrared radiation, barometric pressure, salinity, and currents. Hourly and daily averages of the measurements are sent back to NOAA/PMEL in near real time.
The TAO/Triton array of moored buoys in the tropical Pacific. Atlas buoys are operated by the Pacific Marine Environmental Laboratory. Triton buoys are operated by the Japan Agency for Marine-Earth Science and Technology (JAMSTEC).
From NOAA Pacific Marine Environmental Laboratory (NOAA PMEL).
Schematic drawing of the Atlas mooring and instruments used in the TAO Array in the Pacific.
From NOAA Pacific Marine Environmental Laboratory.
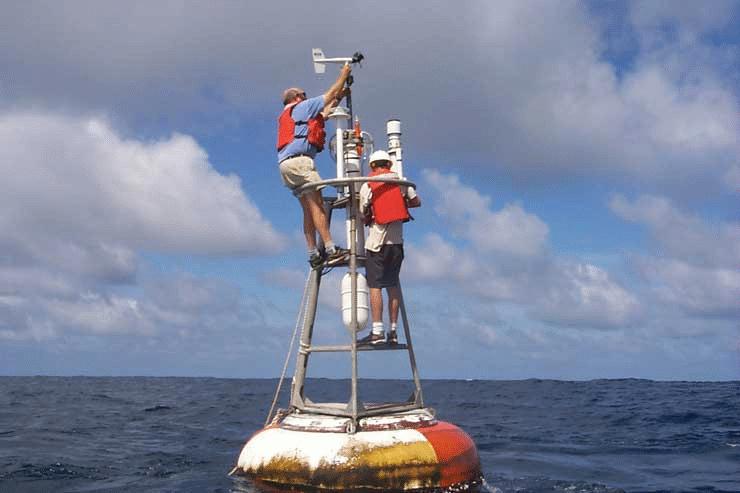
Photograph of technicians servicing an Atlas moored buoy in the tropical Pacific.
From NOAA Pacific Marine Environmental Laboratory.
The observations are used to monitor and forecast El Niño. The results are at their Real-Time Data page.
Satellite Measurements
Satellites now continuously observe the ocean, reporting their observations back to national weather and ocean forecasting agencies.
Sea-Surface Temperature
Temperature is measured by the Advanced Very High Resolution Radiometer
AVHRR on NOAA polar-orbiting weather satellites. The instrument measures
infrared radiation emitted from the sea surface. It cannot observe through
clouds. But by making maps every day, and averaging the maps over a period
of days or weeks, the influence of clouds is greatly reduced. By combining
the AVHRR measurements with buoy and ship measurements of surface temperature,
maps of temperature have an accuracy of about 0.3°C.
The US Navy and NOAA publish average maps of sea-surface temperature and temperature anomalies used to monitor the evolution of El Niño/La Niña in the Pacific.
Ocean Heat Content
The amount
of heat in the upper few hundred meters of the ocean is measured by satellite
altimeters. Here is the explanation:
- Warm water has more heat per kilogram than cold water.
- Warm water is also less dense than cold water. This means that a column of warm water is longer than a column of cold water (this is an example of thermal expansion).
- Sea level is higher in regions with a deep layer of warm water at
the surface, and lower in regions with a thin layer of warm water.
Look at this map of anomalies of sea surface height made using data from April 2008 from the Jason altimeter satellite. From the NASA Jet Propulsion Laboratory El Niño Watch.
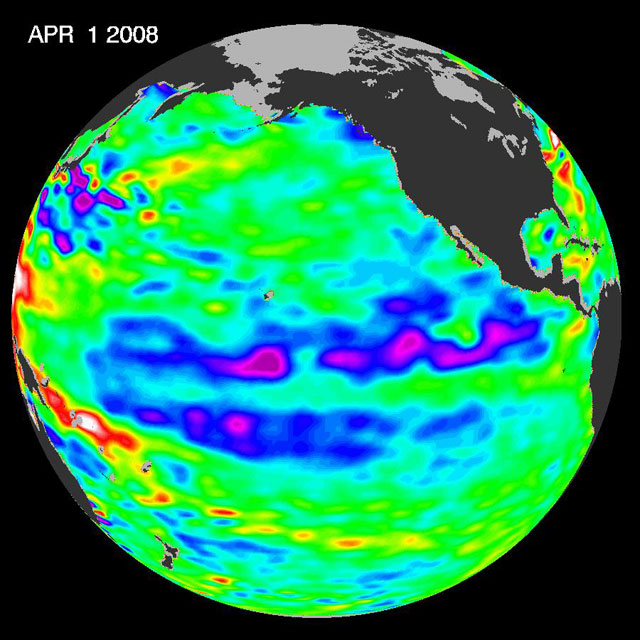
- Unusually high heat content causes unusually high sea surface height shown in red.
Satellite altimeters measure sea level with great accuracy. The measurements are used to map the heat content of the upper ocean, which is proportional to the thickness of the warm layer near the sea surface. If the warm surface layer increases in thickness by 2 m, sea level increases by 1 cm.
Satellite altimeter systems include a radar to measure the height of the satellite above the sea surface and a tracking system to determine the height of the satellite in geocentric coordinates. The system measures the height of the sea surface relative to the center of mass of Earth. Both systems have an accuracy of about 1 cm.
The Jason satellite. The large circular antenna at the earth side of the satellite is the altimeter radar transmit and receive antenna. The blue solar cells provide power. Electronics and control systems are in the gold box. Other instruments help determine the position of the satellite and to make small corrections to the altimeter measurements.
From NASA Jet Propulsion Laboratory Surface Topography Missions web page.
The radar altimeter on the satellite measures its height above the sea with an accuracy of about 1 cm.
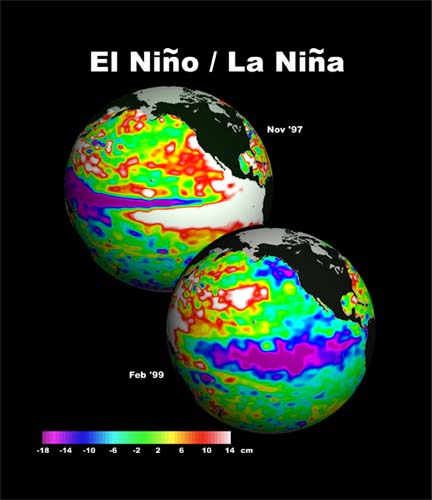
The image shows the differences in sea level measured by the Topex\Poseidon altimeter satellite during the 1997 El Niño and 1999 La Niña.
From NASA Jet Propulsion Laboratory.
The Jason satellite has been monitoring sea level globally, and in the Pacific, since December 2001, producing maps of sea level every 10 days. The latest maps of the Pacific are distributed by the Jason Project at the NASA Jet Propulsion Laboratory.
You can read more about satellite altimeter observations of the Pacific at NASA' web page Eye on the Ocean. The Jet Propulsion Laboratory has more information on how altimeter satellites, such as Topex/Poseidon and Jason 3, the latest altimeter satellite are able to make accurate maps of sea level from space.
Wind Velocity
Winds are measured globally once per day by a special type of radar, a
scatterometer,
carried on the QuikScat
satellite mission. The scatterometer measures the roughness of the
ocean due to waves with wavelength of a few centimeters. The stronger
the wind, the rougher the surface, and the greater the amount of radio
energy reflected from the surface. The reflected energy is also a function
of the angle between the wind and radar beam. The reflection is strongest
when the scatterometer looks upwind. The instrument measure wind velocity
on a 25 km grid once per day.
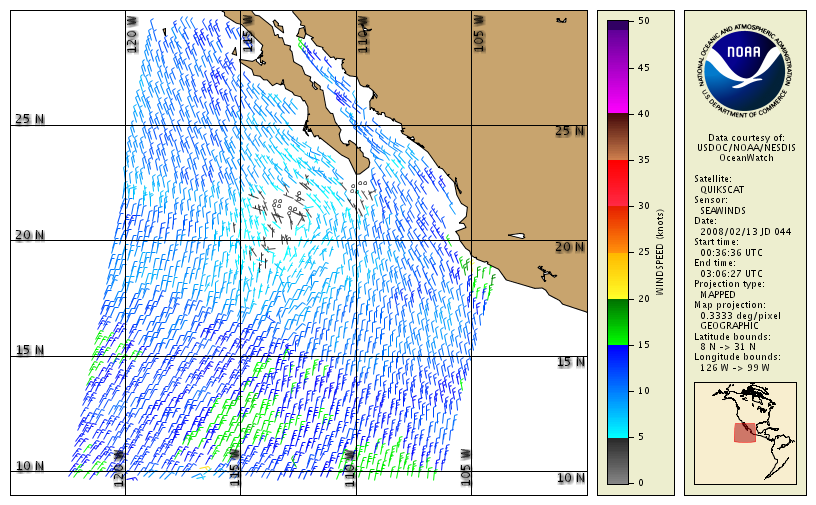
Recent maps of ocean winds are produced and distributed by Remote Sensing Systems.
Map of sea-surface winds in the eastern tropical Pacific measured by the QuikScat scatterometer on 13 February 2008. Similar data collected during a 24-hour period, are used to make global maps.
Rain
Rain over the tropical ocean is measured by the Tropical
Rainfall Measuring Mission TRMM. The satellite uses various radio and
radar instruments to measure rainfall rates which are used to produce monthly
maps of rainfall. Data are distributed by Remote
Sensing Systems and by the Goddard Space Flight Center.
Average rainfall over the 30-day period ending 13 February 2008 as measured by the Tropical Rainfall Measuring Mission.
From NASA Goddard Space Flight Center Tropical Rainfall Measuring Mission.
Drifters and Floats
Large numbers of surface drifters and subsurface floats report on surface and subsurface conditions throughout the upper 2 km of the ocean.
Argo Floats
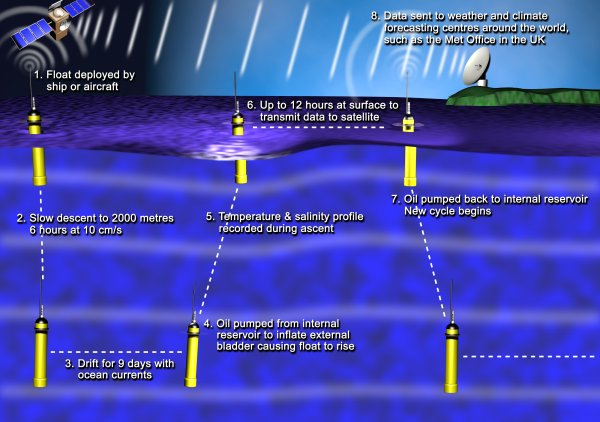
Argo is an international collaboration that collects high-quality temperature and salinity profiles from the upper 2000m of the ice-free global ocean and currents from intermediate depths. The data come from battery-powered autonomous floats that spend most of their life drifting at depth where they are stabilized by being neutrally buoyant at the "parking depth" pressure by having a density equal to the ambient pressure and a compressibility that is less than that of sea water. At present there are three models of profiling float used extensively in Argo. All work in a similar fashion but differ somewhat in their design characteristics. At typically 10-day intervals, the floats pump fluid into an external bladder and rise to the surface over about 6 hours while measuring temperature and salinity. Satellites determine the position of the floats when they surface, and receive the data transmitted by the floats. The bladder then deflates and the float returns to its original density and sinks to drift until the cycle is repeated. Floats are designed to make about 150 such cycles.
From How Argo Floats Work.
Typical 10-day cycle of Argo float operation. From UK Met Office Argo Web Page.
Distribution of Argo floats in the Pacific on 27 August 2007. Red points are tentative deployments for 2007.
From Argo Deployment Plans and Positions.
There is much more information at the Argo Project's Home Page.
Surface Drifters
These instruments drift close to the sea surface. Their position is tracked
every day by satellite. Changes in position, divided by the time interval
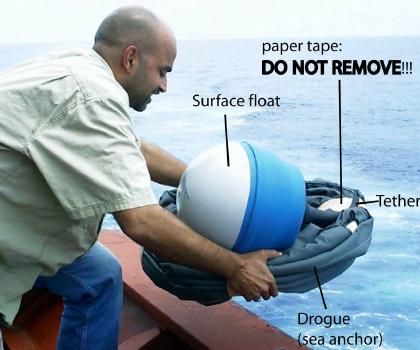
of the change, give surface currents. The drifter consists of a small surface
float and a very large (0.92 m diameter, 6.44 m long) holey-sock drogue.
The float is small so it is not pushed by winds at the sea surface. The
drogue is large so the small force of the wind on the float does not
pull the drifter through the water at a speed that is large enough to
produce an error. The error is about 0.7
cm/s per 10 m/s of wind speed.
Thousands of drifters have been deployed in all oceans over the past decade.
Deployment of a holey-sock drifter.
From The Global Drifter Program.
Revised on: 29 May, 2017