
The Ocean's Influence on North American Drought
We have already seen that the ocean influences the atmosphere:
- The ocean is the primary heat source driving the atmospheric circulation.
- The ocean is the primary source of moisture that falls on land.
Modes of Atmospheric Variability
The interaction of the ocean and atmosphere involves variability of all periods from much less than a day to centuries to millions of years. The interactions change the transport of water to the continents, leading to flooding at one extreme to drought on the other. Some of the interactions are particularly important and relatively well known.
El Niño/Southern
Oscillation
This is perhaps the most important and well
known example of an interannual interaction. This is described in the El
Niño chapter.
Arctic Oscillation
Sometimes called
the northern hemisphere annular mode, this is the year-to-year variability
pf weather patterns at high latitudes in the northern hemisphere. The
variability was first noticed in the north Atlantic, and the interaction
was called the North Atlantic Oscillation. Winds in the north Atlantic
varied as the Icelandic Low and the Bermuda High pressure areas strengthened
and weakened. Further studies showed the variations in weather
patterns extended throughout the northern hemisphere, and the oscillation
was renamed.
The two phases of the Arctic Oscillation: Left– Warm Phase; Right– Cold Phase. Notice that storms come ashore in Europe at different latitudes in the two phases. This strongly influences European weather, especially in winter.
From The National Snow and Ice Data Center's web page on the Arctic Oscillation.
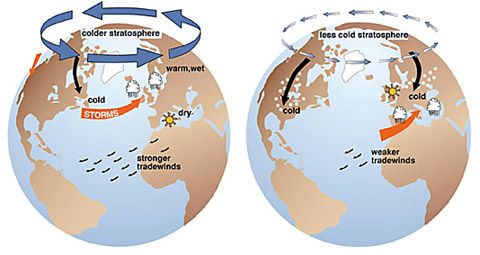
- The oscillation is characterized by sea-level pressure anomalies of one sign in the Arctic and anomalies of opposite sign centered about 37-45N.
- The high index or warm phase of the Arctic Oscillation is defined as periods of below normal Arctic sea-level pressure, enhanced surface westerlies in the north Atlantic, warmer and wetter than normal conditions in northern Europe, and stronger trade winds at lower latitudes. This phase is shown on the left in the figure above. It is associated with the positive values of the North Atlantic Oscillation index (shown below).
- The low index or cold phase is characterized by higher sea-level pressure in the Arctic, weaker westerlies, colder winters in North America and Europe, and weaker trade winds. This phase is shown on the right in the figure above. It is associated with negative values of the North Atlantic Oscillation index (shown below).
- The cause of the AO and the NAO is still unknown.
The historical variability of the Arctic Oscillation.
From Joint Institute for the Study of the Atmosphere and Ocean, Arctic Oscillation Time Series Web Page.
The NOAA Climate Prediction Center gives recent values and predictions of future values a season in
Pacific Decadal Oscillation
This is
similar to El Niño,
but operating over periods of 20-30 years.
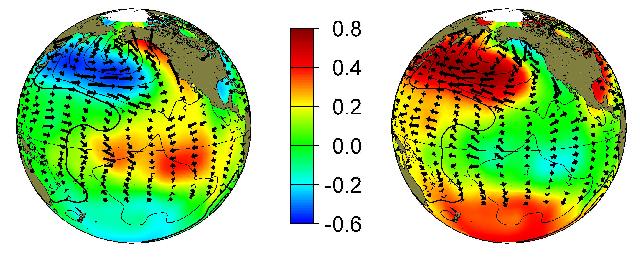
Left: Warm (positive) phase; Right: Cool (negative) phase of the Pacific Decadal Oscillation.
From Joint Institute for the Study of the Atmosphere and the Ocean, University of Washington, web page on the Pacific Decadal Oscillation.
Pacific Decadal Oscillation Index.
From the Climate Impacts group of the Center for Science in the Earth System web page on the Pacific Decadal Oscillation.
The Pacific Decadal Oscillation is related to weather over north America.
Influence of the Pacific Decadal Oscillation on weather over North America.
Top: October to march air temperature anomalies during the warm phase, contours in 0.2°C.
Bottom: Contour map of correlation coefficients between gridded North American December-February (DJF) precipitation and the SST-based Pacific Decadal Oscillation index, based upon data for the period 1900-93.
From Mantua: The Pacific Decadal Oscillation and Climate Forecasting for North America.
Positive PDO values
are usually associated with wetter conditions in the
Southwestern United States, while negative PDO values
are suggestive of persistent drought in the Southwest.
From Robert H. Webb, Richard Hereford, and Gregory J. McCabe. (2000)
Climatic Fluctuations,
Drought,
and Flow
in the
Colorado River.
Atlantic Multidecadal Oscillation
This is the pattern of changes in surface temperature over
large areas of the tropical Atlantic over periods of several decades.
Recent research suggests that the AMO is related to the past occurrence of major droughts in the Midwest and the Southwest. When the AMO is in its warm phase, these droughts tend to be more frequent and/or severe (prolonged?). Vice-versa for negative AMO. Two of the most severe droughts of the 20th century occurred during the positive values of the AMO between 1925 and 1965: The Dust bowl of the 1930s and the 1950s drought. Florida and the Pacific Northwest tend to be the opposite - warm AMO, more rainfall.
From Atlantic Multidecadal Oscillation web page of the Atlantic Oceanographic and Meteorological Laboratory.
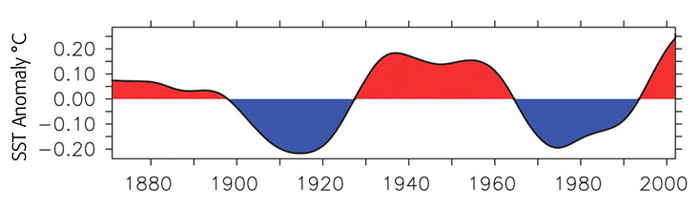
The Atlantic Multidecadal Oscillation index of North Atlantic temperature anomalies.
From Atlantic Climate Pacemaker for Millennia Past, Decades Hence? by Richard Kerr (2005).
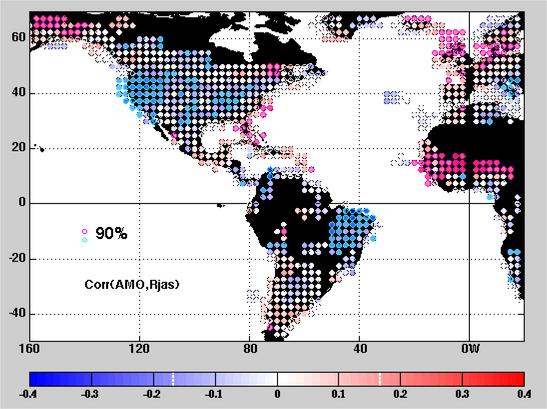
Red and blue colored dots represent positive and negative correlations of Northern Hemisphere summer rainfall with the AMO index. When the value of the AMO is positive (warm Atlantic) there is less rainfall over most of the United States and northeastern South America, and more rainfall in southern Alaska, northern Europe, west Africa and Florida.
From Atlantic Multidecadal Oscillation web pages at the NOAA Atlantic Oceanographic and Meteorological Laboratory.
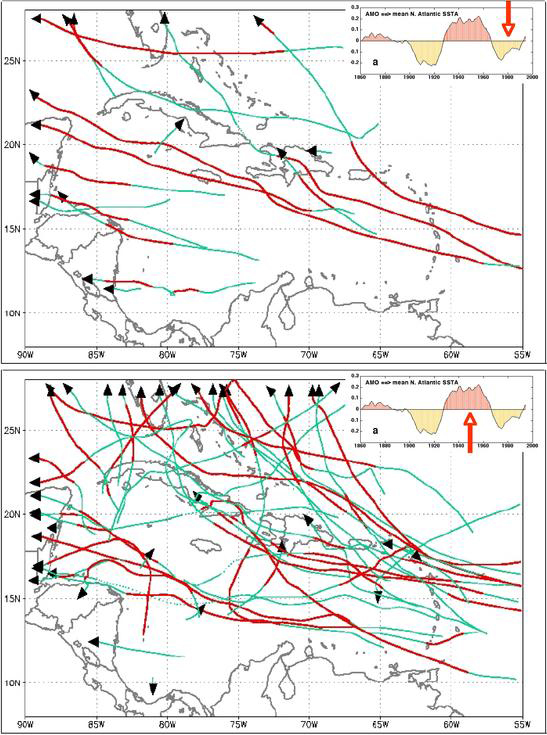
The Atlantic Multidecadal Oscillation also influences the number of hurricanes in the Atlantic.
From United Nations Environmental Programme Grid Arendal web page on Intense hurricanes in the Atlantic Basin.

Paths of Atlantic hurricane during the two phases of the Atlantic Multidecadal Oscillation.
Top: Cold Phase. Bottom: Warm Phase.
From From Atlantic Multidecadal Oscillation web pages at the NOAA Atlantic Oceanographic and Meteorological Laboratory.
North American Drought
Drought over north America has been correlated to the Atlantic Multidecadal Oscillation and the Pacific Decadal Oscillation. The correlations account for the drought in the Great Plains during the 1930s dust bowl and more recent droughts.
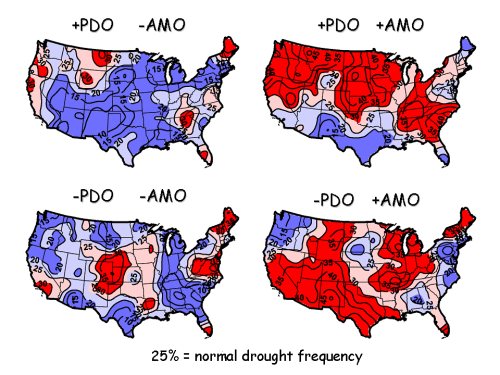
The relationship between drought in the continental US and the phases of the Pacific Decadal Oscillation (PDO) and the Atlantic Multidecadal Oscillation (AMO). The most severe droughts occur when the PDO is in a negative phase, and the AMO is in a positive phase.
From McCabe (2004).More than half (52%) of the space and time variance in multidecadal drought frequency over the conterminous United States is attributable to the Pacific Decadal Oscillation (PDO) and the Atlantic Multidecadal Oscillation (AMO). An additional 22% of the variance in drought frequency is related to a complex spatial pattern of positive and negative trends in drought occurrence possibly related to increasing Northern Hemisphere temperatures or some other unidirectional climate trend. Recent droughts with broad impacts over the conterminous U.S. (1996, 1999-2002) were associated with North Atlantic warming (positive AMO) and northeastern and tropical Pacific cooling (negative PDO). Much of the long-term predictability of drought frequency may reside in the multidecadal behavior of the North Atlantic Ocean. Should the current positive AMO (warm North Atlantic) conditions persist into the upcoming decade, we suggest two possible drought scenarios that resemble the continental-scale patterns of the 1930s (positive PDO) and 1950s (negative PDO) drought.
—McCabe (2004)
The Pacific Decadal Oscillation and Atlantic Multidecadal Oscillation since 1895.
From McCabe (2004).
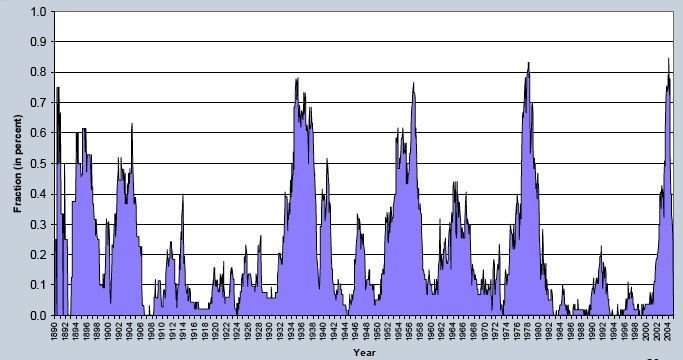
Fraction of Colorado in drought averaged over a running 48-month period.
From Nolan (2004) The Climate of Colorado: an update and status report.
For more information, read Climatic Fluctuations, Drought, and Flow in the Colorado River Basin by the US Geological Survey (2004).
Fire in the American West
Forest fires in the western United States are significantly correlated with ENSO. The correlation accounts for about half of the variance of areas burned by fires from 1905 to 1985. Fires are common during La Niño conditions, and much less common during El Niño (Swetnam 1990).
Time series of annual area burned in Arizona and New Mexico and the Southern Oscillation Index during December, January, and February (DJF). Low values of the index lead to rains in the spring growing season and less fire the following summer.
From Swetnam (1990).
References
Kerr, R. A. (2005). CLIMATE CHANGE: Atlantic Climate Pacemaker for Millennia Past, Decades Hence? Science 309 (5731): 41-43.
McCabe, G. J., M. A. Palecki, et al. (2004). Pacific and Atlantic Ocean influences on multidecadal drought frequency in the United States. Proceedings of the National Academy of Sciences, 101 (12): 4136-4141.
Swetnam, T. W. and J. L. Betancourt (1990). Fire-Southern Oscillation Relations in the Southwestern United States. Science 249 (4972): 1017–1020.
Fire scar and tree growth chronologies (1700 to 1905) and fire statistics (since 1905) from Arizona and New Mexico show that small areas burn after wet springs associated with the low phase of the Southern Oscillation (SO), whereas large areas burn after dry springs associated with the high phase of the SO. Through its synergistic influence on spring weather and fuel conditions, climatic variability in the tropical Pacific significantly influences vegetation dynamics in the southwestern United States. Synchrony of fire-free and severe fire years across diverse southwestern forests implies that climate forces fire regimes on a subcontinental scale; it also underscores the importance of exogenous factors in ecosystem dynamics.
Revised on: 29 May, 2017