El Niño Policy Issues
If El Niño forecast are good, but not perfect, what are the implications for society? To answer the question, pretend you are a farmer in Texas. You know El Niño tends to bring winter rains and that a wetter year is good for crops. You can decide to plant crops that depend on good rains and reap a bumper crop. But, what if the forecast is wrong? Then planting crops that need rain might be a disaster. Do you bet the farm on the forecast or do you hedge your bet?
The Environmental and Societal Impacts Group at the University Center for Atmospheric Research provides some guidance in their report on Prediction In Policy which discusses how policy makers interpret and use forecasts such as El Niño forecasts. They conclude that successful forecasts are based on:
an institutional structure that allows policy makers, decision makers, and scientists to interact closely throughout the entire prediction process, so that each knows the needs and capabilities of the others. It is crucial that this process be open, participatory, conducive to mutual respect. Efforts to shield expert research and decision making from public scrutiny and accountability invariably backfire and fuel distrust and counterproductive policies and decisions.
From Environmental and Societal Impacts Group.
Problems With Forecasts
- Are we forecasting El Niño or the results of El Niño
for some region? Usually it is the latter. Can we even know if some
event is due to El Niño? Newspapers often state one or another
local event was probably due to El Niño. In the example illustrated
below, a newspaper attributed some deaths that occurred during the
great ice storm of January 1998 (there were 30 fatalities) to El Niño.
Yet the chain of logic from the equatorial
Pacific to the deaths by carbon monoxide poisoning is very long, and
almost certainly incorrect.
From the La Nina Summit Meeting.
- The forecast of a local event may be wrong. Forecasts are not 100% accurate, and some are wrong, some are very wrong. Some people bet the farm on the forecast, and are devastated when the forecast turns out to be wrong.
- Or those reading the forecast don't really understand what the forecast means even if it is right.
An Example-The Red River Flood of April 1997
To see how even good forecasts can lead to trouble, consider the recommended changes in forecast policy resulting from Roger A. Pielke's analysis of the Red River Flood of 1997. During the event, Grand Forks North Dakota was flooded.
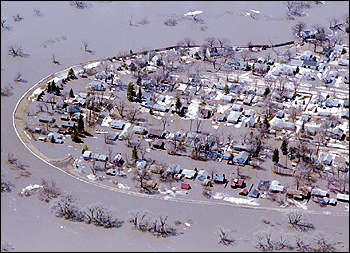
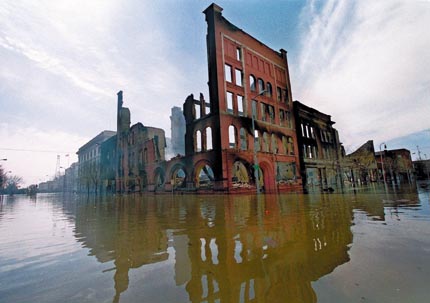
Left: Red River flood at Grand Forks , North Dakota 1997. Right:
Downtown building destroyed by fire during the flood. From Grand
Forks Herald.
The North Central River Forecast Center predicted weeks in advance that the Red River would reach a very high stage of 47.5 feet based on one assumption, and 49 feet based on another. Both numbers are uncertain by about 10% based on previous flood predictions.
Yet the community leaders misunderstood the numbers, and concluded 49 feet was the maximum predicted height, not 49 + 4.9 feet.
In interviews conducted in May 1997 with various decision makers in the Red River of the North basin, it is clear that different people interpreted the flood stages outlooks in different ways, some of which are demonstrably incorrect. These different perspectives clearly influenced the choices made by local officials. Some viewed the two numbers as a range, i.e., that the maximum flood stage would be between 47.5-49 feet. Others viewed the higher number as a maximum, i.e., a value that would not be exceeded. For example, on April 8, 1997 The Grand Forks Herald wrote that "[NWS] experts are still forecasting a maximum 49-foot crest for the Red at East Grand Forks" (Foss 1997, emphasis added). Others viewed the flood outlook as exact, i.e., "the crest will be 49 feet." Still others viewed the 49 foot outlook as somewhat uncertain; examples of the uncertainty ascribed to the outlook by various decision makers ranged from 1 to 6 feet. Which decision maker might have been correct is not known as the flood outlooks did not include any quantitative information with respect to the uncertainty in the outlook. Clearly throughout the community, people "anchored" their thinking to the 49 foot outlook, which was reinforced through repetition over time.
From Pielke's Analysis.
Roger A. Pielke's analysis of the community's response to the forecasts led him to conclude:
- The NWS needs to better understand the uncertainty inherent in its own outlooks and forecasts. Information about uncertainty and predictability has potential value to decision makers.
- The NWS needs to explore how to better communicate uncertainty to decision makers. Misuse of predictions can lead to greater costs than if no prediction were provided.
- Local decision makers need to explore ways to become more forecast-independent. Less reliance on forecasts will reduce the effects of uncertainty.
- Responsibility for flood flight decision making belongs at the local level. The NWS should not place itself in the position of determining how much risk a community should face.
- The policy research community needs to focus more attention on understanding the actual use and misuse of predictions. As the forecast community develops a greater range of more sophisticated products, more attention will have to be paid to their appropriate use. Misuse of predictions can result in large costs and loss of support for NWS activities.
Application to El Niño
Seasonal forecasts have impacts that can rival the impacts of the phenomena being forecast. Thus, dealing with the impacts of forecasts is one of the greatest challenges facing the climate forecasting community... Advancement in the science of seasonal forecasting seems to have outpaced advancements to the effective use of those forecasts.
Roger Pielke (2000).
The recommendations for improving flood forecasts apply to all environmental forecasts, including El Niño forecasts.
- Forecasts should contain clear statements of uncertainty.
- Users of the forecasts must understand what is being forecast, and the uncertainty of the forecast.
- Users can not be expected to have a clear understanding of rare events. We base our response to forecasts on previous experience, and we usually have no prior experience with rare events such as the El Niño of the century. We have no experience with forecasts of climate change extending several decades into the future.
- Because all forecasts are uncertain, society should strive to
be forecast independent.
- Don't build cities in areas likely to fe flooded.
- Don't plant assuming an El Niño forecast is accurate.
- Don't build home close to the beach on the Texas Coast.
References
Pielke, Roger A. 2000 Guest Editorial: A warning about seasonal forecasting. The ENSO Signal, 13.
Revised on: 29 May, 2017