
El Niño Teleconnections
Teleconnections
Teleconnections are statistically significant correlations between weather
events that occur at different places on the Earth.
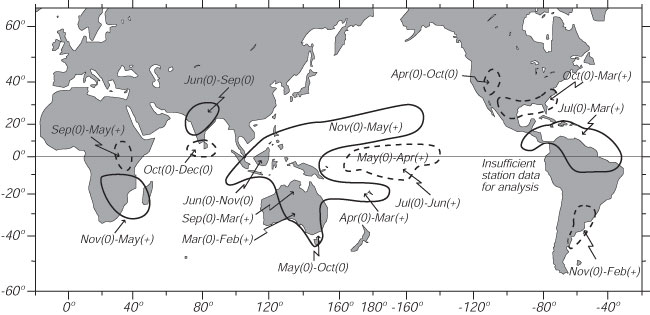
Sketch of regions receiving enhanced rain (dashed lines) or drought (solid lines) during an El Niño event. (0) indicates that rain changed during the year in which El Niño began, (+) indicates that rain changed during the year after El Niño began.
From Ropelewski and Halpert (1987).
What Causes the Teleconnections?
The pattern of teleconnections is caused by the El Niño and La
Niña variability in the equatorial Pacific, which changes the
position of the major heat source that drives the atmospheric circulation.
When the equatorial rainy area moves from the far-western equatorial
Pacific to the central equatorial Pacific, the atmosphere must adjust.
The adjustment changes weather patterns around the globe. The changing
patterns are called teleconnections.
- The NOAA PMEL page on Impacts of El Niño gives a picture of the global influence as well as the influence on North America.
- NOAA Climate Prediction Center provides maps of the influence of El Niño on US temperature and precipitation.
- The University of Florida's Center For Ocean-Atmospheric Prediction Studies gives the influence on North American tornado frequency as well as other impacts.
- In the United States, tornados are more common during La Niña and less common during El Niño (see effects for area near Dallas).
- Texas rainfall is greater during El Niño.
- US Winter rainfall, and temperature are also influenced by El Niño.
- NOAA's Atlantic
Oceanographic and Meteorological Laboratory gives the influence
on Atlantic
hurricanes. Hurricanes most commonly hit the US
during La Niña.
_F2.jpeg)
Left: Tracks of Atlantic Hurricanes August to October, 1950-2001 for El Niño years (red) and La Niña years (blue).
From International Research Institute for Climate and Society.
Right: Density of tropical cyclone tracks during the period 1950 to 2006 for three patterns of sea-surface temperature in the equatorial Pacific. EPW– East Pacific Warm pattern (El Niñ0), CPW– Central Pacific Warm pattern (weak El Niño), and EPC– East Pacific Cold pattern (La Niña). Blue shades indicate fewer than normal cyclones in the region, red shades indicate more cyclones than normal. Areas inside white contours are statistically significant at the 90% level. Areas inside the dark contours are statistically significant at the 95% level. Click on the image for a zoom that shows the land areas more clearly.
From Kim et al (2009).
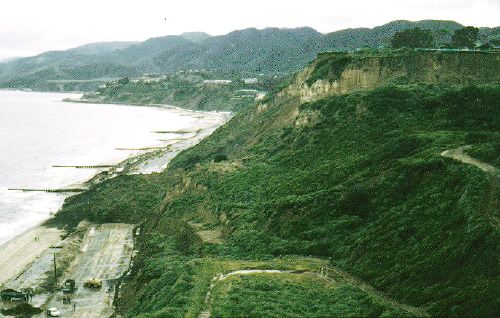
- The US Geological Survey publishes information on the geological effects of El Niño.
Photograph of Via de las Olas, Pacific Palisades in Southern California in March 1958 showing landslide that crossed highway onto beaches. Note prominent scarp at headwall of slide on right.
From US Geological Survey, Geologic mapping and El Niño in southern California.
The El Niño forecasts are used along with other data to produce seasonal forecasts for various regions.
- The Climate Prediction Center produces seasonal outlooks for the continental United States.
- Other products are
listed at their products
page.
Influence of La Niña (left) and El Niño (right) on tornado frequency over the US in March, April, and May based on data from 1950 to 1992. El Niño events reduce tornado activity in the southern plain states, while La Niña events increase tornado activity in the Ohio River Valley and Deep South. Furthermore, El Niño inhibits the chances of multiple tornado outbreaks, while La Niña facilitates large tornado outbreaks and produces more devastating tornadoes.
From Bove (1999).
References
Bove, Mark C. 1999 Impacts Of ENSO On United States Tornadic Activity. Center for Ocean-Atmospheric Prediction Studies (COAPS), The Florida State University.
Kim, H.-M., P. J. Webster, et al. (2009). Impact of Shifting Patterns
of Pacific Ocean Warming on North Atlantic Tropical Cyclones. Science 325
(5936): 77–80.
Two distinctly different forms of tropical Pacific Ocean warming are shown to
have substantially different impacts on the frequency and tracks of North Atlantic
tropical cyclones. The eastern Pacific warming (EPW) is identical to that of
the conventional El Niño, whereas the central Pacific warming (CPW) has
maximum temperature anomalies located near the dateline. In contrast to EPW events,
CPW episodes are associated with a greater-than-average frequency and increasing
landfall potential along the Gulf of Mexico coast and Central America. Differences
are shown to be associated with the modulation of vertical wind shear in the
main development region forced by differential teleconnection patterns emanating
from the Pacific. The CPW is more predictable than the EPW, potentially increasing
the predictability of cyclones on seasonal time scales.
Revised on: 29 May, 2017