Lecture 18: International Trade and the Current Account |
||||||||||||||||||||||||||||||||||||||||||||||||||||||||||||||||||||||||
|
This lecture presents some data on the actual trade patterns and then tries to make some sense out of them. |
||||||||||||||||||||||||||||||||||||||||||||||||||||||||||||||||||||||||
Some Basic Definitions |
||||||||||||||||||||||||||||||||||||||||||||||||||||||||||||||||||||||||
|
· Exports and Imports of merchandise are goods that we sell to other countries or buy from other countries. |
||||||||||||||||||||||||||||||||||||||||||||||||||||||||||||||||||||||||
|
· The Net Merchandise Trade Balance is the difference between exports and imports of merchandise. |
||||||||||||||||||||||||||||||||||||||||||||||||||||||||||||||||||||||||
|
· Balance on Goods and Services is just the difference between exports and imports of goods and services. (This is the familiar X-M in the GDP formula) |
||||||||||||||||||||||||||||||||||||||||||||||||||||||||||||||||||||||||
|
· Net Investment Income is the return on American-owned assets abroad (such as a Goodyear plant in Luxembourg) less the return on foreign-owned assets in the United States (the Honda plant in Maryville). |
||||||||||||||||||||||||||||||||||||||||||||||||||||||||||||||||||||||||
|
· Unilateral transfers are such things as remittances by foreigners living in the United States to their families in their home country, military grants, etc. |
||||||||||||||||||||||||||||||||||||||||||||||||||||||||||||||||||||||||
|
· Balance on Current Account is the total of the balance of goods and services, net investment income, and unilateral transfers. |
||||||||||||||||||||||||||||||||||||||||||||||||||||||||||||||||||||||||
|
· Net Capital Outflows represent purchases by Americans of assets abroad, including investment in foreign businesses. |
||||||||||||||||||||||||||||||||||||||||||||||||||||||||||||||||||||||||
|
· Net Foreign Inflows represent purchases by foreigners of American assets, including investment in the United States. |
||||||||||||||||||||||||||||||||||||||||||||||||||||||||||||||||||||||||
|
·
Statistical
Discrepancy is a category used to make the numbers balance. Collecting the data is a difficult task,
and it is subject to errors. |
||||||||||||||||||||||||||||||||||||||||||||||||||||||||||||||||||||||||
The Current Account |
||||||||||||||||||||||||||||||||||||||||||||||||||||||||||||||||||||||||
|
· A country’s current account balance equals its trade balance plus its net income from past investments in other countries. |
||||||||||||||||||||||||||||||||||||||||||||||||||||||||||||||||||||||||
|
·
A country has a current
account deficit when domestic saving does not cover domestic investment
and the government’s deficit. It then
borrows to finance the extra investment. |
||||||||||||||||||||||||||||||||||||||||||||||||||||||||||||||||||||||||
|
·
A country has a current
account surplus when domestic saving more than covers domestic investment
and the government’s deficit. It then
lends the difference to people in other countries. |
||||||||||||||||||||||||||||||||||||||||||||||||||||||||||||||||||||||||
|
· A country that borrows money has a current account deficit. |
||||||||||||||||||||||||||||||||||||||||||||||||||||||||||||||||||||||||
Data on American International Trade |
||||||||||||||||||||||||||||||||||||||||||||||||||||||||||||||||||||||||
|
Now, let us look at some American Data. |
||||||||||||||||||||||||||||||||||||||||||||||||||||||||||||||||||||||||
|
|
||||||||||||||||||||||||||||||||||||||||||||||||||||||||||||||||||||||||
|
||||||||||||||||||||||||||||||||||||||||||||||||||||||||||||||||||||||||
Some patterns |
||||||||||||||||||||||||||||||||||||||||||||||||||||||||||||||||||||||||
|
· Currently we export fewer goods than we import (the difference is about 2-3% of GDP). The services sector surplus offsets about 40% of the merchandise (goods) deficit. |
||||||||||||||||||||||||||||||||||||||||||||||||||||||||||||||||||||||||
|
· Foreigners are investing more in the United States than we are investing abroad. |
||||||||||||||||||||||||||||||||||||||||||||||||||||||||||||||||||||||||
Historical Data on International Trade |
||||||||||||||||||||||||||||||||||||||||||||||||||||||||||||||||||||||||
|
Let us also consider some historical data on international trade. |
||||||||||||||||||||||||||||||||||||||||||||||||||||||||||||||||||||||||
|
|
||||||||||||||||||||||||||||||||||||||||||||||||||||||||||||||||||||||||
|
||||||||||||||||||||||||||||||||||||||||||||||||||||||||||||||||||||||||
|
|
||||||||||||||||||||||||||||||||||||||||||||||||||||||||||||||||||||||||
|
||||||||||||||||||||||||||||||||||||||||||||||||||||||||||||||||||||||||
What causes Current Account Deficits or Surpluses |
||||||||||||||||||||||||||||||||||||||||||||||||||||||||||||||||||||||||
|
The United States has run a substantial current account deficit recently. Reports of this deficit give rise to alarming stories, which generally take two forms: |
||||||||||||||||||||||||||||||||||||||||||||||||||||||||||||||||||||||||
|
· We are gutting our manufacturing base in this country. |
||||||||||||||||||||||||||||||||||||||||||||||||||||||||||||||||||||||||
|
· How will we ever pay these deficits back? |
||||||||||||||||||||||||||||||||||||||||||||||||||||||||||||||||||||||||
|
Let us take up each of these arguments in turn. |
||||||||||||||||||||||||||||||||||||||||||||||||||||||||||||||||||||||||
The Gutting of the Manufacturing Base |
||||||||||||||||||||||||||||||||||||||||||||||||||||||||||||||||||||||||
|
That manufacturing is moving offshore should be neither surprising nor unwelcome. An advanced economy such as the United States does not have a comparative advantage in light manufacturing. It does not take a lot of skill or capital to sew most garments. Thus, it makes sense for all of those activities to move offshore. |
||||||||||||||||||||||||||||||||||||||||||||||||||||||||||||||||||||||||
|
The textile industry provides a classic example of an industry moving to its comparative advantage. In the 19th century, the textile industry was concentrated in New England, in order to take advantage of cheap waterpower. Lowell Massachusetts was the prototypical "mill town". The term "Lowell Girl" was used to describe a woman who had left her family farm to work in one of the textile mills. The process of running these mills was not physically demanding and the mill owners loved cheap labor. |
||||||||||||||||||||||||||||||||||||||||||||||||||||||||||||||||||||||||
|
In the 1920's and 1930's the textile mills began to move south to take advantage of cheap labor and cheap electric energy. (Lower transportation costs also helped). New England congressmen viewed this with alarm. The New England manufacturing base was being gutted and it was impossible for New England to compete with cheap southern labor. They responded by having Congress enact a minimum wage, ostensibly to protect poor southerners from exploitation and to assure them a living wage. In reality, their objective was to protect New England jobs. As is often the case, the government was ineffective, and the textile mills left anyway. (The textile mills gave way to new high technology industries more appropriate to the New England labor force). |
||||||||||||||||||||||||||||||||||||||||||||||||||||||||||||||||||||||||
|
The textile mills did not stay in the South. They first moved to the proverbial low wage Asian Economy, Japan. As Japan prospered, the mills moved again, to China. As China is developing, the mills are moving elsewhere in Southeast Asia. Do not be surprised if in 15 years, you read stories about the difficulties of competing with African-made textiles. |
||||||||||||||||||||||||||||||||||||||||||||||||||||||||||||||||||||||||
The Deficits Per Se |
||||||||||||||||||||||||||||||||||||||||||||||||||||||||||||||||||||||||
|
The second issue is, of course, the deficits. Our standard textbook discussion of the international trade assumes a tit-for-tat exchange. We export $X worth of goods in which we have a comparative advantage and import $X of goods in which we do not. In fact, the normal process of international trade can and does lead to substantial trade deficits and surpluses. |
||||||||||||||||||||||||||||||||||||||||||||||||||||||||||||||||||||||||
|
To understand the source of the deficits, we need to turn back to our basic equation for the demand and supply of loans. Recall our basic equation, given almost at the beginning of this course: |
||||||||||||||||||||||||||||||||||||||||||||||||||||||||||||||||||||||||
S = I + (G -
T) + (X - M)
|
||||||||||||||||||||||||||||||||||||||||||||||||||||||||||||||||||||||||
|
|
||||||||||||||||||||||||||||||||||||||||||||||||||||||||||||||||||||||||
|
We can rewrite this equation as |
||||||||||||||||||||||||||||||||||||||||||||||||||||||||||||||||||||||||
|
|
||||||||||||||||||||||||||||||||||||||||||||||||||||||||||||||||||||||||
M - X = (I -
S) + (G - T)
|
||||||||||||||||||||||||||||||||||||||||||||||||||||||||||||||||||||||||
|
That is, the balance of payments, or the difference between imports and exports, equals the difference between domestic saving and investment and the government deficit. |
||||||||||||||||||||||||||||||||||||||||||||||||||||||||||||||||||||||||
Capital Flows |
||||||||||||||||||||||||||||||||||||||||||||||||||||||||||||||||||||||||
|
Most economists believe the first term, the difference between domestic saving and investment explains the source of the difference, and that capital flows come about because investment opportunities are more attractive in one country than another. A couple of examples will illustrate this point. |
||||||||||||||||||||||||||||||||||||||||||||||||||||||||||||||||||||||||
|
· Consider a hypothetical South Sea Island, which you have just discovered and claimed as your own. You decide to develop the island as a tourist resort, and spend $100 million developing a resort complex. Perhaps the money comes out of your pocket. Perhaps the money comes out of some other investor's pocket. In any case, the steel, concrete, Jacuzzis, etc., all come from abroad. There is simply no way to develop the resort other than by importing these goods. Since there are no offsetting exports, you have a deficit on current account. You are not being foolish to run a current account deficit. Indeed, given the investment potential of your new resort, you would be foolish not to run the current account deficit. |
||||||||||||||||||||||||||||||||||||||||||||||||||||||||||||||||||||||||
|
· In the last part of the 19th century, the United States ran a substantial current account deficit, financed substantially by the British. The reason was quite simple. There were significant investment opportunities in this rapidly growing economy. For example, this was a significant period of railroad expansion. The rails had to come from somewhere, and British factories provided them. Both Americans and the British benefited. We got a higher capital stock, while British investors earned a higher return than they could at home. |
||||||||||||||||||||||||||||||||||||||||||||||||||||||||||||||||||||||||
|
· At the end of the Second World War, the United States ran a significant current account surplus, for exactly the same reason. The War devastated Europe, and investment opportunities were highly profitable. |
||||||||||||||||||||||||||||||||||||||||||||||||||||||||||||||||||||||||
|
· In the 1980's just as it began a period of rapid economic growth, the United States began to run a significant current account deficit. The real investment opportunities were in this country. Hence, imported goods financed the economic growth. |
||||||||||||||||||||||||||||||||||||||||||||||||||||||||||||||||||||||||
|
· Consider also the current demand for American currency in Russia. Russians obtain American dollars by selling something to the US. Thus, the demand for currency means a deficit on current account. |
||||||||||||||||||||||||||||||||||||||||||||||||||||||||||||||||||||||||
|
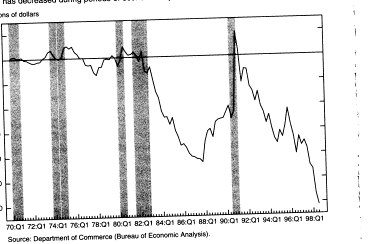
Indeed data on current account deficits both in the United States over time, and around the world support this position. Figure 18-1 shows how our current account deficit has changed over time. The shaded areas of the graph are recession periods. As you can see, when the economy is not doing well, when it does not pay to invest in the United States, our balance on current accounts improves. And, as in times like the present, when our economy is outperforming the rest of the world, the idea of investing in the United States is just as attractive as the hypothetical South Sea Island, and a lot more practical. |
||||||||||||||||||||||||||||||||||||||||||||||||||||||||||||||||||||||||
|
|
||||||||||||||||||||||||||||||||||||||||||||||||||||||||||||||||||||||||
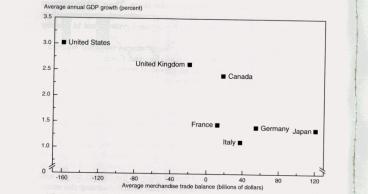
Another piece of information is provided by a comparison of balance on current account of the members of the G-7, the seven large industrial democracies. As you can see from Figure 18-2, the ones with the high growth rates (and hence with the most profitable opportunities for investment have, like our South Sea Island, the greater deficits on current account. |
||||||||||||||||||||||||||||||||||||||||||||||||||||||||||||||||||||||||
|
|
||||||||||||||||||||||||||||||||||||||||||||||||||||||||||||||||||||||||
Living beyond our Means |
||||||||||||||||||||||||||||||||||||||||||||||||||||||||||||||||||||||||
|
There is another possible interpretation of these data. We all know of people who end up spending more than they make, living beyond their means, only to end up in bankruptcy court. It is possible that the same thing is happening to the United States. |
||||||||||||||||||||||||||||||||||||||||||||||||||||||||||||||||||||||||
|
There are problems with this explanation. First, it assumes that foreign investors are stupid, and do not pay heed to be sure of repayment. Second, this country is composed of individuals, and, it is not clear what it means for a "nation" to live beyond its means. |
||||||||||||||||||||||||||||||||||||||||||||||||||||||||||||||||||||||||
|
Moreover, the relation between investment opportunities and deficit on current account is so clear that this notion does not get much respect any more. |
||||||||||||||||||||||||||||||||||||||||||||||||||||||||||||||||||||||||
The role of the government |
||||||||||||||||||||||||||||||||||||||||||||||||||||||||||||||||||||||||
|
Now let us turn to the other term in our equation, G-T, the government deficit. In the 1980's, the United States government ran a substantial deficit. One school of thought was that the current account deficit was simply a means of financing the budget deficit. The experience of the past few years gives the lie to this explanation. The budget deficit has ended, but the current account deficit continues. This experience suggests that the deficit is coming out of the demands of a growing economy. |
||||||||||||||||||||||||||||||||||||||||||||||||||||||||||||||||||||||||
Should Individuals worry at all about the Current Account Deficit? |
||||||||||||||||||||||||||||||||||||||||||||||||||||||||||||||||||||||||
|
The current account deficit gets a lot of attention. However, there is a school of thought that the current account, whether it be in surplus or deficit, is unimportant to individuals. |
||||||||||||||||||||||||||||||||||||||||||||||||||||||||||||||||||||||||
|
· It matters little to me, as a worker, whether I work for a German-owned firm or for an American-owned firm. In either case, I would receive roughly the same pay and benefits. |
||||||||||||||||||||||||||||||||||||||||||||||||||||||||||||||||||||||||
|
· It matters little to me whether I am in debt to a German bank or an American bank. |
||||||||||||||||||||||||||||||||||||||||||||||||||||||||||||||||||||||||
|
· It matters a lot to me how much saving I have, but not whether the money is in a German or American bank. |
||||||||||||||||||||||||||||||||||||||||||||||||||||||||||||||||||||||||
|
· It matters little to me whether you are in debt or not, or whether you are saving for your old age or not. |
||||||||||||||||||||||||||||||||||||||||||||||||||||||||||||||||||||||||
|
· It should matter to you whether you are saving enough |
||||||||||||||||||||||||||||||||||||||||||||||||||||||||||||||||||||||||
Relation to the Text |
||||||||||||||||||||||||||||||||||||||||||||||||||||||||||||||||||||||||
|
Each lecture ends with a section relating it to the text. In some cases, material is omitted, either because the text covers it well enough or because it is not worth learning. In other cases, material is added. Each of these “lectures” will end with a brief note relating the lecture to the text, describing what material is left to the student to learn alone and what material may safely be skipped. |
||||||||||||||||||||||||||||||||||||||||||||||||||||||||||||||||||||||||
Which Chapters does this lecture cover? |
||||||||||||||||||||||||||||||||||||||||||||||||||||||||||||||||||||||||
|
|
||||||||||||||||||||||||||||||||||||||||||||||||||||||||||||||||||||||||
What material is new? |
||||||||||||||||||||||||||||||||||||||||||||||||||||||||||||||||||||||||
|
Trade statistics are covered in detail in the lecture. You are not responsible for specific numbers, but you are responsible for trends. |
||||||||||||||||||||||||||||||||||||||||||||||||||||||||||||||||||||||||
|
The causes of Current Account deficits and surpluses are covered in detail in this lecture. |
||||||||||||||||||||||||||||||||||||||||||||||||||||||||||||||||||||||||
|
©1999 by
Greg Chase and Charles W. Upton. If
you enrolled in Principles of Macroeconomics at Kent State University, you
may print out one copy for use in class.
All other rights are reserved. |
||||||||||||||||||||||||||||||||||||||||||||||||||||||||||||||||||||||||