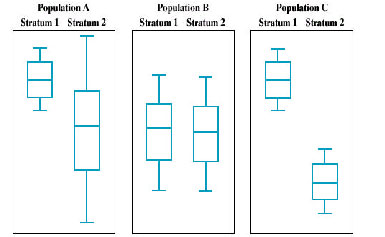
| The following graphs are side-by-side boxplots of some variable for two strata in three hypothetical populations A, B, and C. In each population the units are evenly divided between the two strata. | |
 |
|
|
Consider three sampling designs to estimate the true population mean (the total sample size is the same for all three designs):
|