
Distribution of Plankton
Where Are Phytoplankton?
The distribution of phytoplankton in the ocean has been measured by special instruments in space since 1979. The instruments, called ocean-color scanners, measure the color of the ocean. Color is proportional to the amount of chlorophyll pigments close to the surface, except in sediment-rich water very close to coasts. And the amount of chlorophyll is proportional to the amount of phytoplankton in the water. Water with great numbers of phytoplankton are green. Pure ocean water is deep navy blue.
The first ocean-color scanner, the Coastal Zone Color Scanner, was launched on the Nimbus-7 satellite in 1978. It was followed many years later by SeaWiFS (Sea-viewing Wide Field-of-view Sensor) on the Seastar satellite launched in 1997. The most recent color scanner is MODIS (Moderate Resolution Imaging Spectrometer) on the Terra spacecraft launched in 1999 and the Aqua satellite launched in 2002. To understand how the instrument measures plankton, and why the measurements are important, see Studying Ocean Color From Space Teacher's Guide with Activities.
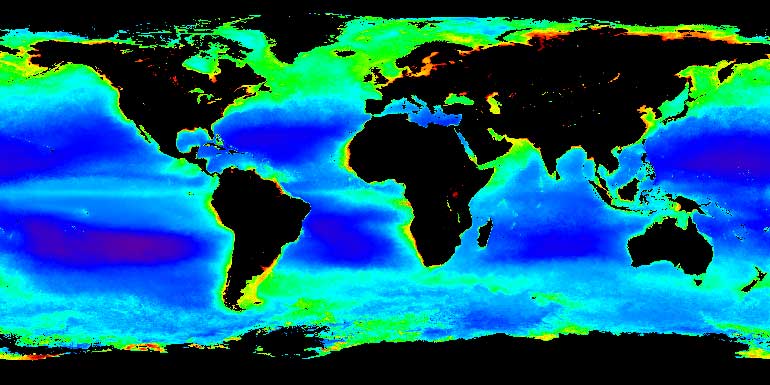
If we look at the global image (below) of chlorophyll concentration calculated from all MODIS data collected from 1 January 2002 to 31 January 2008, we can see where in the ocean phytoplankton is common. A really big image with 9 km resolution is also available. The color scale ranges from 0.1 milligram per cubic meter of chlorophyll pigment (purple) to 60 milligrams per cubic meter (red). Monthly and seasonal global maps of chlorophyll and other data are available from the MODIS (pick the time interval in the pull down menu at top of page).
The ocean-color image shows that phytoplankton are mostly along coasts, along the equator in the Pacific and Atlantic, over continental shelves, and in high latitude oceanic areas, especially in the Atlantic north of a line from Spain to New York. Seasonal images show that concentration peaks in spring and summer. These seasonal changes are best seen in a short film clip, the Pulse of the Planet (scroll down to see video) showing the seasonal change of phytoplankton in the ocean and vegetation on land, produced by Gene Feldman and the SeaWiFS team at NASA's Goddard Space Flight Center.
Global distribution of chlorophyll averaged over the period from 1 January 2002 to 31 January 2008 using data collected from MODIS on the Aqua satellite. Chlorophyll values range from 0.01 mg/m3 (purple) to 60 mg/m3 (red). From NASA Goddard Space Flight Center.
Why High Concentrations Near Coasts?
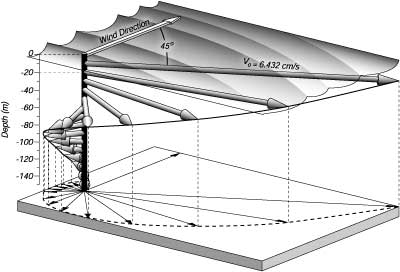
Walfrid Ekman showed in 1905 that steady winds blowing on the seafor a day or longer cause the sea surface to move at an angle of 45° to the right of the wind in the northern hemisphere and to the left of the wind in the southern hemisphere (looking downwind). Currents at deeper levels move at larger angles. Summing up all the currents (integrating from the surface to depth), he found that the transport is 90° to the right of the wind in the northern hemisphere.
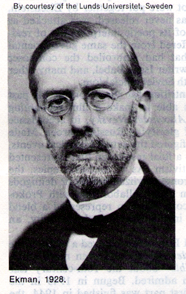
Left: Walfrid Ekman in 1928. In 1905 he published the theory that explains wind-driven currents at the sea surface. Courtesy Lunds Universitet, Sweden, in Encyclopedia Brittanica, 15th Edition, 1974, page 518. Right: Distribution of currents in the upper 140 meters of the ocean generated by a 10 m/s wind at 35° North according to Ekman's theory. From: Introduction to Physical Oceanography, Figure 9.3.
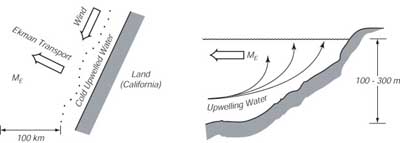
Winds usually blow toward the equator along the west coasts of continents, and the wind pushes water offshore away from the coast. The water is replaced by cold upwelling water that is rich in nutrients (fertilizer for phytoplankton). The nutrients are used by phytoplankton, which feed a local fishery. The cold upwelled water also influences the local climate.
Currents along a west coast in the northern hemisphere due to a north wind. Left: The north (equatorward) wind causes an Ekman transport of water away from the coast. Right: Cross-sectional view. The Ekman transport causes upwelling along the coast that brings nutrients to the sunlit zone at the sea surface, feeding rapid growth of phytoplankton and leading to valuable fisheries.
From: Introduction to Physical Oceanography, Figure 9.7.
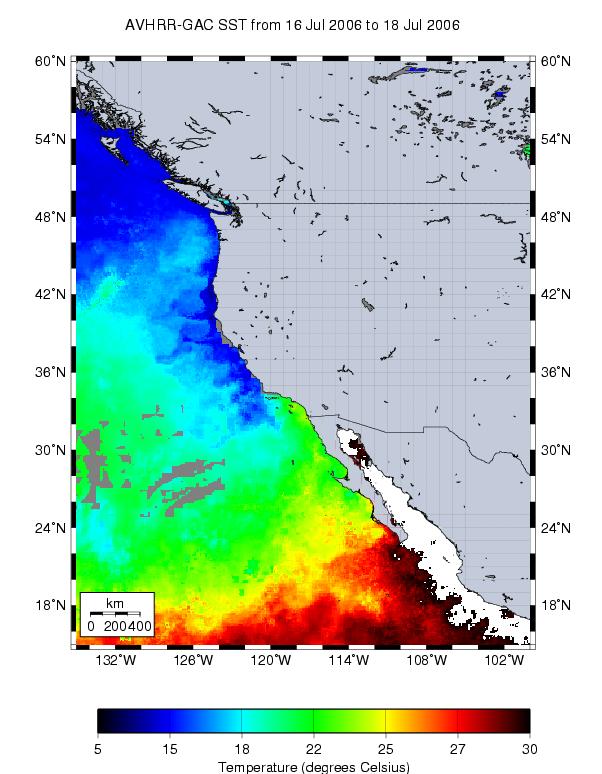
Sea-surface temperature along the California coast measured from space by the Advanced Very High Resolution Radiometer AVHRR. Upwelled water is cold, shown in shades of blue in this image. The area of upwelled water extends from Washington State to near San Diego. Gray areas over water are cloudy. Recent images are available from University of California, Santa Barbara's Institute for Computational Earth System Science.
From NOAA CoastWatch..
An example of coastal upwelling is described in the Chapter 2. The Benguela Upwelling Zone (PDF file) published by the SeaWiFS Project at the Goddard Space Flight Center of NASA.
Why High Concentrations at High Latitudes?
During the spring and summer, phytoplankton and zooplankton thrive near the sea surface. When they die, they sink and mostly decay (only a few sink to the sea floor without decaying), taking nutrients deeper into the ocean. By late summer the nutrients near the surface have been depleted.
Nutrients, including nitrates, released by decaying organisms build up in the deeper water during the summer. But the nutrients cannot be used for two reasons:
- The nutrients are so far below the surface that sunlight is too weak for photosynthesis.
- Weak winds in summer are not strong enough to mix nutrients back to the surface because warm water near the surface inhibits mixing.
In winter, when the surface is cooler, strong winter storms mix nutrients back to the surface. Then, when daylight becomes stronger and longer in spring, phytoplankton use the nutrients and once more become abundant.
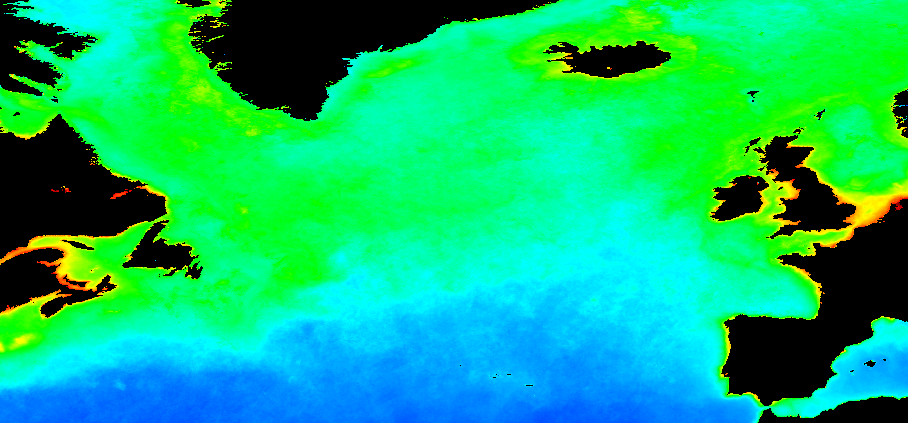
High chlorophyll concentrations in the far north Atlantic. Chlorophyll averaged over the period from 1 January 2002 to 31 January 2008 using data collected from MODIS on the Aqua satellite. Chlorophyll values range from 0.01 mg/m3 (purple) to 60 mg/m3 (red). From NASA Goddard Space Flight Center.
Equatorial Regions
Trade winds blow from east to west in equatorial regions of the the Atlantic and Pacific. Just north of the equator, Ekman transports are to the north. Just south of the equator, they are to the south. The divergence of transport causes upwelling along the equator. In the eastern parts of the ocean, the upwelling brings up nutrient rich, cool water that nourishes phytoplankton.
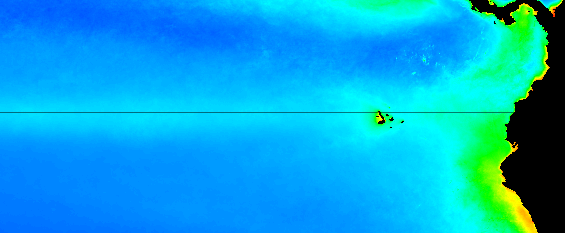
High chlorophyll concentration on the equator (solid black line) in the eastern Pacific. Chlorophyll averaged over the period from 1 January 2002 to 31 January 2008 using data collected from MODIS on the Aqua satellite. Chlorophyll values range from 0.01 mg/m3 (purple) to 60 mg/m3 (red).
From NASA Goddard Space Flight Center.
High-Nutrient, Low-Chlorophyll Regions
Some regions seem to have sufficient nutrients but very few phytoplankton live there. These are called high-nutrient, low-chlorophyll zones. One such region is the area around Antarctica. Far fewer phytoplankton are found in the far south Atlantic than in the far north Atlantic. Phytoplankton are scarce around Antarctica because the water lacks iron, a critical trace element. See The Carbon Cycle, the Ocean, and the Iron Hypothesis for more information about high-nutrient, low-chlorophyll zones.
High-nutrient, low-chlorophyll region in the South Pacific near the Drake Passage. Chlorophyll averaged over the period from 1 January 2002 to 31 January 2008 using data collected from MODIS on the Aqua satellite. Chlorophyll values range from 0.01 mg/m3 (purple) to 60 mg/m3 (red).
From NASA Goddard Space Flight Center.
Continental Shelf Areas
Continental-shelf regions tend to have large concentrations of chlorophyll and phytoplankton. In these areas, organisms cannot sink deep into the sea and decay. They decay in relatively shallow water, and winds can recycle the nutrients back to the surface where they can be reused. The regions are also close to land, so they have sufficient iron due to runoff from the land, and from dust blown offshore from the land.
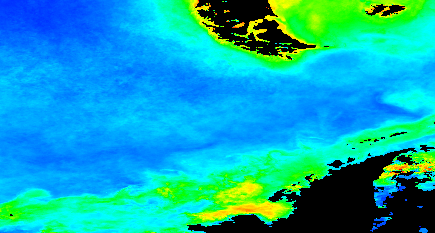
Chlorophyll concentrations in the Bering Sea (northeast of the Aleutian Islands), a continental shelf region with shallow water. Chlorophyll averaged over the period from 1 January 2002 to 31 January 2008 using data collected from MODIS on the Aqua satellite. Chlorophyll values range from 0.01 mg/m3 (purple) to 60 mg/m3 (red).
From NASA Goddard Space Flight Center.
Open Ocean, Mid-Latitude Regions
Open-ocean, mid-latitude regions, such as the region east of Florida or west of Baja California, typically have very low phytoplankton densities. This is because the regions are far from the source of nutrients, runoff from land, and because they are regions of downwelling, not upwelling. North of the regions in the northern hemisphere, wind is from west to east, and the wind pushes surface waters to the south. South of the regions, the wind is from east to west, pushing water northward. The convergence of surface water causes downwelling.
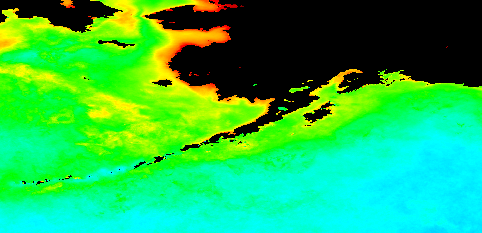
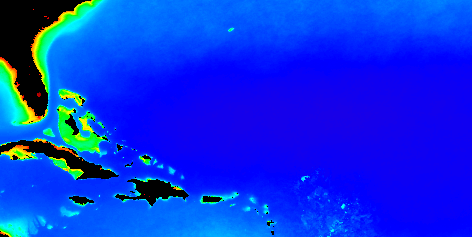
Region of very low chlorophyll concentration east of Florida. Chlorophyll averaged over the period from 1 January 2002 to 31 January 2008 using data collected from MODIS on the Aqua satellite. Chlorophyll values range from 0.01 mg/m3 (purple) to 60 mg/m3 (red).
From NASA Goddard Space Flight Center.
Summary
Phytoplankton are abundant in regions where:
- Winds are able to mix nutrients up into near surface waters from deeper in the ocean, or where winds blow dust out to sea, providing the small amount iron needed by the phytoplankton.
- Where Ekman transports driven by the winds pulls
water up from deeper in the ocean,
- When winds blow toward the equator along west coasts of continents, and
- When the average winds blowing at different speeds and directions cause divergence of the Ekman transports,
Revised on: 27 May, 2017