
Tsunamis
What Causes Tsunamis?
Tsunamis are rare but potentially disastrous waves. There were 498 tsunamis in the 20th century, causing 66 deaths (Rhodes et al, 2006). Of the 498 tsunamis,
- Earthquakes caused 86%. Notable historical examples are the great Sumatran earthquake on 26 December 2004, and the Alaskan Earthquake of 28 March 1964.
- Volcanic activity caused 5%, mostly on oceanic islands. Notable historical examples are the eruption of Santorini (Thera) in 15th century BC, which destroyed the Minoan civilization, and Krakatoa in Indonesia on August 26, 1883.
- Landslides caused 4%. A notable historical example is the Lituya Bay landslide of 9 July 1958 which generated a tsunami that reached 1720 feet above sea level.
- The remaining 5% were caused by a combination of the processes listed above.
- Meteorite or asteroid impacts have also caused tsunamis, but they are much rarer. The only know examples were millions of years ago.
Tsunamis Propagation
If an earthquake, landslide, or volcano generates a tsunami, it propagates away from the source zone as a shallow-water ocean wave. Such waves have a wavelength that is greater than the depth of the water. They propagate at a velocity equal to the square root of the [depth in meters times the acceleration of gravity in meters/(second squared) (9.8 m/s2)]. In the deep ocean, the water is about 4,000 meters deep, so the wave propagates at a velocity of 200 m/s, or 450 miles per hour. To test if the waves really are shallow-water waves, we can use tide-gauge measurements of the tsunami's period. The period at Male in the Maldives was about 40 minutes as measured at the tide-gauge station, which gives a wavelength of 480 km, much greater than the 4 km depth of the ocean. Many other gauges give similar periods, although the gauge at Port Louis, Mauritius, gives a the period closer to 11 minutes, or a wavelength of 130 km. The tide gauge data were collected by the University of Hawaii Sea Level Center, which collects real-time data from gauges in the Pacific and Indian Ocean.
The propagation of the tsunami can be calculated by numerical models, which need information about the sea-floor motion at the earthquake epicenter, which can be calculated from seismic data. Here is an animation of the wave propagating through the Indian Ocean (5.8 Mbytes) by Vasily Titov of the Pacific Marine Environmental Laboratory of NOAA. Here is a NOAA map of the wave propagating (5.2 MBytes) around the world.
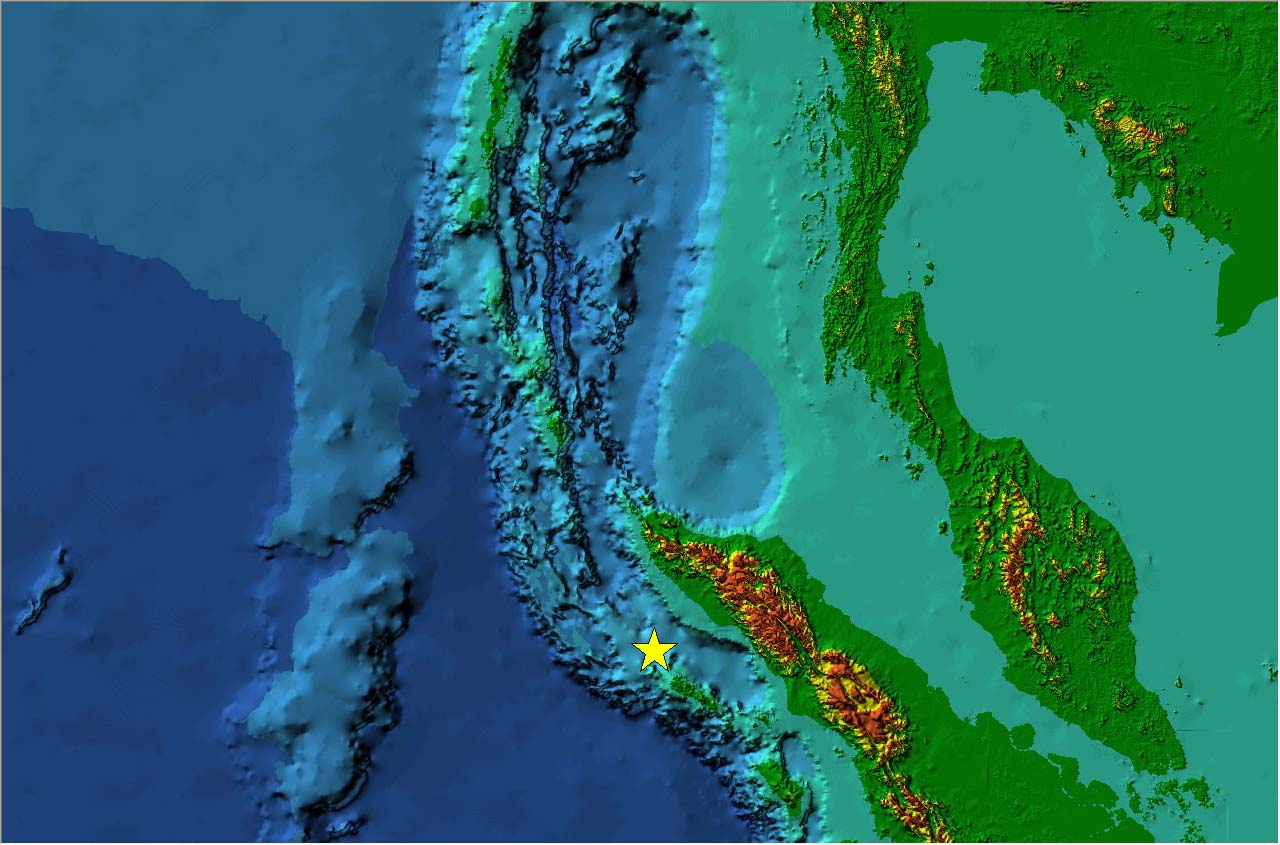
A tsunami has a relatively small amplitude in the open ocean well away from coasts. As the wave propagates, it is influenced by the shape of the sea floor, and it can be focused and refracted by subsea ridges and other features. The seafloor near Sumatra and Thailand is complex and it has a strong influence on the tsunami. (Map from the Tsunami Laboratory, Institute of Computational Mathematics and Mathematical Geophysics, Novosibirsk, Russia.)
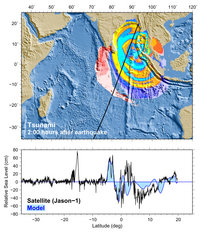
Numerical models can calculate the propagation of the tsunami, but the calculations are difficult to test because a tsunami is rarely measured in the open ocean except at the location of the few buoys used in the tsunami warning network. Fortunately, the Indian Ocean tsunami was measured by the altimeter on the Jason satellite. Data from the instrument showed that the wave south of India had an amplitude of around 60 centimeters. The measurements were compared with predicted from a NOAA numerical model, and the measurements and predictions agreed well for the for the largest wave 2-3 hours after the earthquake, but the agreement was much worse for the smaller waves seven hours after the earthquake.
Tsunami observed by Jason (Click on Image for the Story)
Top: Track of the satellite altimeter across Indian Ocean at time of tsunami.
Bottom: Height measured by the altimeter , compared with output from numerical model.
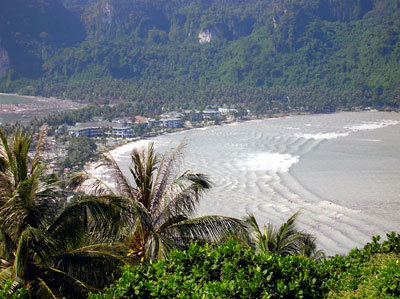
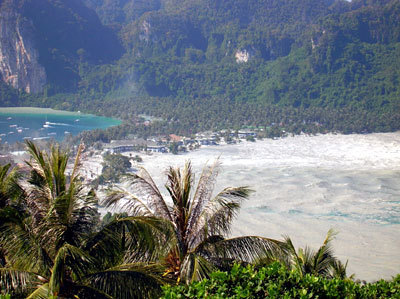
Island tide gauges far from the earthquake measured heights of 2 meters at Port Louis, 1 m at Diego Garcia, 1.8 m at Gan, 2.5 m at Male. At shores close to the earthquake, the waves were estimated to be as high as 15 m (50 feet). The videos show waves reaching the second floor of buildings set back from the sea, around 5 m or more above sea level.
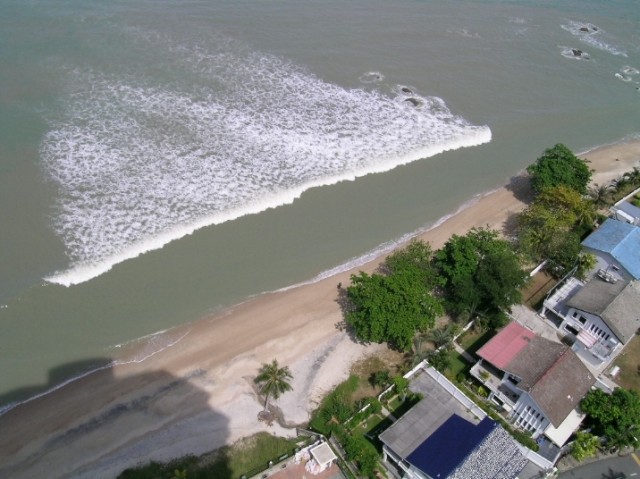
As the wave approaches land it steepens and becomes much higher. One mile off the coast of Phuket, a boat, the Mercator measured the height of the tsunami and got a maximum height of 6.6 meter using its depth recorder. Still closer to land, the wave eventually becomes so steep it breaks and comes ashore as a rapid rise of sea level. The videos show the wave breaking in some areas, but not in others. How it breaks depends on the slope and shape of the sea floor offshore of the beach, and the height of the tsunami.
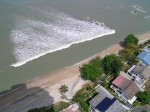
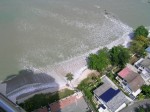

Four views of a tsunami coming ashore (click on image for larger view).
Left: Tsunami wave at Penang, Malaysia on 26 December 2004 at 12:39 PM ICT (Indochina Coordinated Time = UT + 7:00) and 12:52 PM ICT showing the first wave rolling towards Tanjung Bungah and T.Tokong Beaches.
(Images from http://flickr.com/photos/egold-prein/page4/ . Photos are public, but copyright A.Prein & S.Prein).
Right: Tsunami wave at Koh Phi Phi, Thailand on Sunday, Dec. 26, 2004 taken by Mountain Brook, Alabama residents J.T. and Caroline Malatesta while on vacation. They appear to be waves reflected from the beach.
(Images from http://www.al.com/galleries/birminghamnews/index.ssf)

As the wave washes ashore, it not only destroys buildings, but currents associated with the wave erode the beach. The satellite photos show severe erosion along some beaches. The erosion was especially severe in Sumatra and Thailand because the beaches appear to be sandy.
The Guardian carried first-hand accounts of the Sumatran tsunami. The BBC also has accounts. More from the Huffington Post.
Tsunami Warning Network
There was great loss of life in the Indian Ocean because coastal residents were not warned of the approaching tsunami. In the Pacific, the warning network consists of links to the global seismic network to detect large earthquakes below or close to the ocean, buoys offshore of subduction zones to measure tsunami waves height with an accuracy of a millimeter and report the information back to a warning center, and software to help predict the size of the wave and the time it would take to reach distant coasts. But no warning network exists in the Indian Ocean. The seismic network detected the large quake, but those who knew about the quake could not reach anyone able to warn coastal residents. Even after the tsunami reached Thailand, no one was able to determine that Sri Langka was in danger, and no warning reached that island or India.
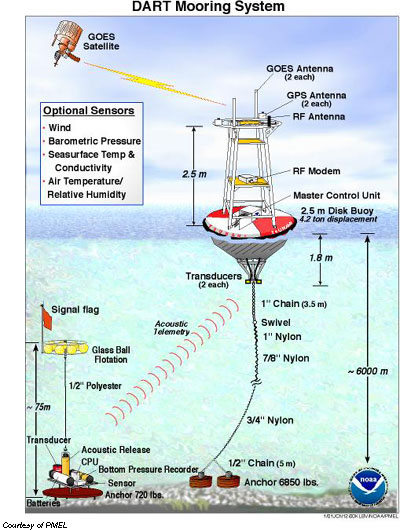
Mooring system used to detect tsunamis in deep water that report data in real time.
From http://www.ndbc.noaa.gov/Dart/dart.shtml
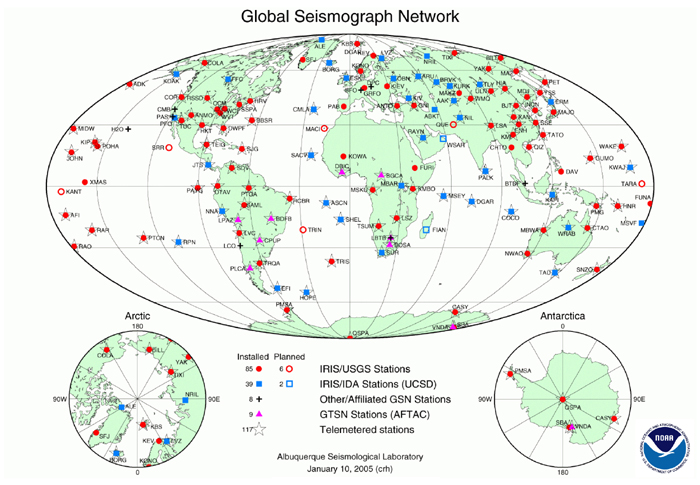
Global Seismograph Network
From http://aslwww.cr.usgs.gov/Stations/gsn_map.gif
References
Rhodes, B., M. Tuttle, et al. (2006). "Palestinian research." EOS Transactions American Geophysical Union 87 (21): 205, 209.
Revised on: 29 May, 2017