

Air Mass Climate Indicators
Project Information:
As part of a NOAA-funded project, two indices of global climate change were developed: the Warm/Cool Index (WCI) and the Global Extremes Index (GEI). These climate indicators are based upon air masses - or multivariate weather situations (like, for example, hot and humid, or cold and dry) - defined using the gridded weather typing classification, version 2 (GWTC2).
- The Warm/Cool Index (WCI) is representative of the expanse of the Earth's surface that is covered by any of the three warm GWTC2 air masses (Dry Warm, Warm, Humid Warm), relative to the amount of area covered by any of the three cool GWTC2 air masses (Dry Cool, Cool, Humid Cool). Greater values indicate more area covered by warm air masses. The index has been robustly standardized to the 1981-2010 climate normal period.
- The Global Extremes Index (GEI) represents the amount of Earth's surface area covered by one of the 'extreme' GWTC2 air masses (Dry Warm, Humid Warm, Dry Cool, Humid Cool). Greater values indicate greater spatial coverage of these extremes. The index has been robustly standardized to the 1981-2010 climate normal period.
- Earth-AMPS (Earth's Air Mass Percentage Split) is an easily-interpretable version of the WCI (note the near-perfect correlation between Earth-AMPS and WCI). It is simply the percentage of the Earth's surface area covered by any of the three warm GWTC2 air masses (Dry Warm, Warm, Humid Warm) minus the percentage of area covered by any of the three cool GWTC2 air masses (Dry Cool, Cool, Humid Cool). The result is a simple percentage-point difference, with positive values indicating more area of the Earth is covered by unseasonably warm air than is covered by unseasonably cold air. So when your uncle states half-seriously, "Where is all that global warming?" just because it is winter, you can point him to this, and note that Earth's average temperature is more than just what's happening outside your window.
Historical WCI and GEI Index Values
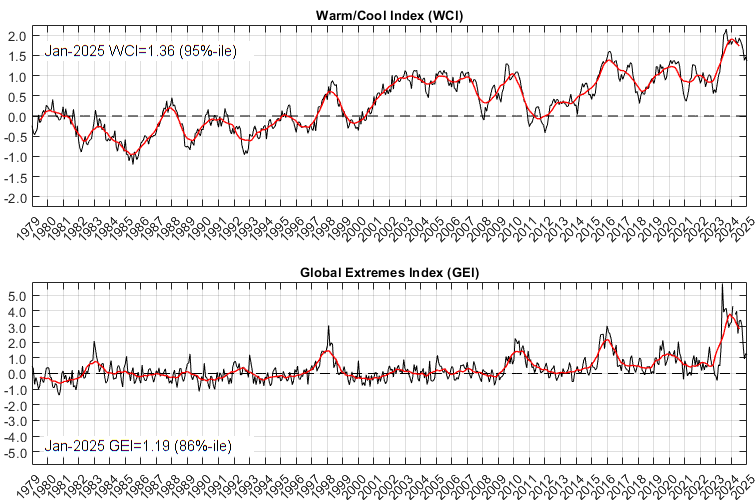
Black line shows monthly averaged WCI (top) and GEI (bottom) values. Red line is the 12-month centered moving average of the monthly values.
Historical Earth-AMPS Values
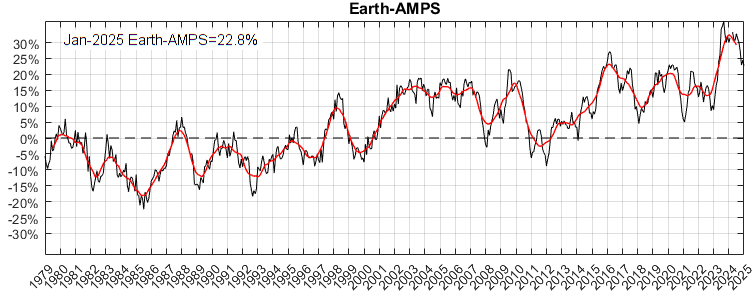
Black line shows monthly averaged Earth-AMPS values. Red line is the 12-month centered moving average of the monthly values.
Links to Project Data:
The files below have either the daily or monthly-scale WCI, GEI, and Earth-AMPS values. These files are updated monthly, when the GWTC2 data are updated. Please email me with any questions (cclee@kent.edu).
Research on the WCI and GEI is published in: Lee CC. 2020. Trends and variability in air mass frequencies: indicators of a changing climate. Journal of Climate 33(19), 8603-8617. DOI: 10.1175/JCLI-D-20-0094.1.
This research was funded by the U.S. National Oceanic and Atmospheric Administration (NOAA; Award#: NA17OAR4310159; PI: Cameron C. Lee, Kent State University). Please feel free to use these data free of charge for scientific research purposes. We only ask that you cite this webpage as the data source, and the publication cited above outlining the development of these data.