
Great Lakes Regional Water Clarity
Project Information:
Based upon previous work by our research team (with collaborators from NOAA, USF and Kent State) in the Gulf of Mexico (Lee, 2016), this NASA-funded project investigated the development of a water clarity index for the Great Lakes as a climate indicator. Broadly, the aims of the project were:
- to develop a daily-scale water clarity index (KDI) using blended satellite data for sub-basins of the Great Lakes;
- relate atmospheric circulation patterns, near-surface synoptic-scale weather types, and discharge data to the KDI;
- use artificial neural network time series models (nonlinear autoregressive models with exogenous input - or NARX models) to model the relationship between climate & KDI in the satellite period (from 1998-2015);
- and finally, extrapolate these NARX models to: 1) reconstruct a full histroical (1979-2015) daily time series of KDI, 2) establish Great Lakes KDI as a climate indicator and examine any link to climate change, and 3) develop and maintain a realtime 60-day forecast of regional KDI.
The data for this project can be found using the links and images below. Forecast data are updated regularly. This webpage will also be updated with publications when they come out.
Notes about forecast data: As of October 2020, the forecasted KDI now include real-time previous values of KDI for each region in the initialization of the models. There are two caveats to this upgrade: 1) due to NASA satellite recalibration since model training, a percentile-based conversion must be used to convert new initialization data into values representative of training data; and 2) due to latency between real-time forecasts and science-quality satellite data (5 days), final initialization data may be imperfect. Both of these caveats will likely result in slightly poorer forecasts. For questions, please contact Dr. Lee (cclee@kent.edu).
Download historical KDI reconstruction data here (1979-2015)
Download realtime KDI forecast data here
60-Day Forecast Loop of KDI (updated daily around 22z):
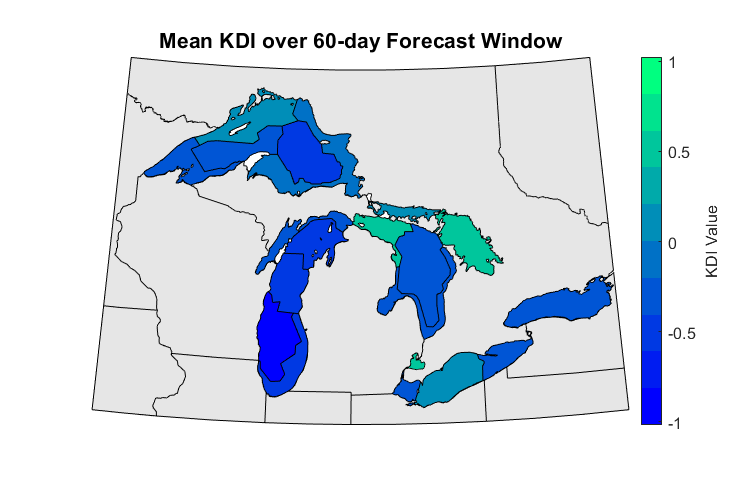
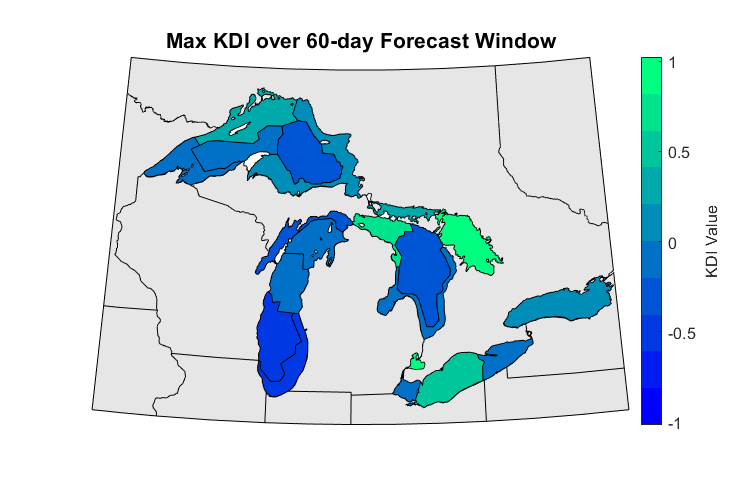
NOTE: High KDI values = more turbid water; low KDI values = clearer water. Not all regions are modeled equally well (see this document regarding model performance).
60-Day Forecasts of KDI (updated daily around 22z):
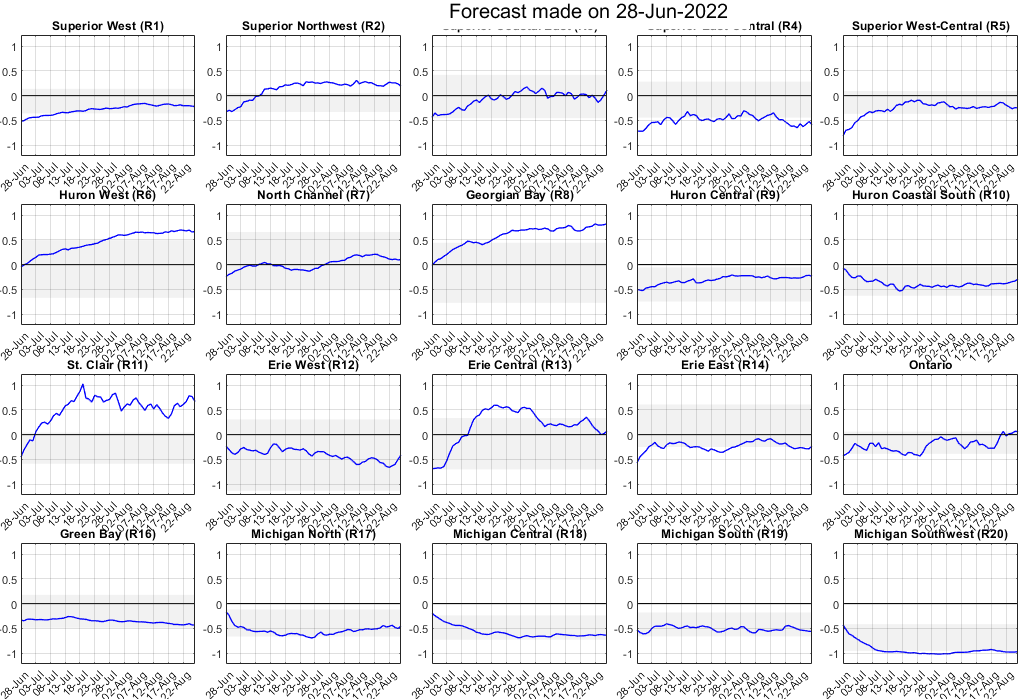
Blue lines are ensemble averages of forecasted KDI for Day 1 - Day 60, with gray lines showing a linear interpolation of KDI on days when lake-ice covers the region. High KDI values indicate more turbid water, lower values are clearer water. Gray boxes indicate the 5th to 95th percentiles of KDI for each region, based upon 2013-2015 values. Plots with no lines indicate that the region is projected to have ice cover for the entire forecast window. Please see this image for locating regions by numbers. Not all regions are modeled equally well (see this document regarding model performance).
Forecasted mean regional KDI (rows) for various forecast windows (columns):
Blank cells indicate missing data due to forecasted ice cover.
Additional Links to Project Data:
Time Series of 37-Year Reconstruction of KDI (1979-2015)
Historical KDI Models (1979-2015) and Observations (1997-2015)
Input Data for Model (including daily SOM patterns)
Monthly and Annual NARX Model Performance (run on closed-loop)
Self Organizing Maps (SOMs) of Atmospheric Patterns:
- Spatial Gradient of z500 (m)
- Spatial Gradient of MSLP (mb)
- 850mb Temperatures (°C)
- 10-meter Wind (m/s)
This research was funded by the U.S. National Aeronautics and Space Administration (NASA; Award#: NNX16AH12G; PI: Scott Sheridan, Kent State University). Please feel free to use these data free of charge for scientific research purposes. We only ask that you cite this webpage as the data source, and the two publications below that describe this research project:
Lee CC, Barnes BB, Sheridan SC, Smith ET, Hu C, Pirhalla DE, Ransibrahmanakul V, Adams RE. 2020. Using machine learning to model water clarity in the Great Lakes. Journal of Great Lakes Research (Accepted, in press). DOI: 10.1016/j.jglr.2020.07.022.
Smith ET, Lee CC, Barnes BB, Adams RE, Pirhalla DE, Ransibrahmanakul V, Hu C, Sheridan SC. 2020. A synoptic climatological analysis of the atmospheric drivers of water clarity variability in the Great Lakes. Journal of Applied Meteorology and Climatology 59(5), 915-935. DOI: 10.1175/JAMC-D-19-0156.1.