

Gridded Weather Typing Classification
The gridded weather typing classification (GWTC) system is a geographically- and seasonally-relative classification of multivariate surface weather conditions (weather types) for North America. Using six near-surface weather variables (temperature, dew point, sea-level pressure, cloudiness, wind speed, and wind direction) from the North American Regional Reanalysis (NARR; Mesinger et al., 2006), the GWTC classifies every day since 1979 into one of 11 different weather types at over 9000 locations. While the 9 'core weather types' mostly relate to different temperature and humidity conditions, the two transitional weather types identify the passage of traditional cold fronts and warm fronts. The GWTC-2 is a global-scale edition of the original GWTC, with some minor differences, and can be found here.
The idea behind the GWTC was to be somewhat of a 'feels-like' classification. For example, say in Cleveland, Ohio in mid-January, there is a daytime high temperature of 59°F (15°C). To someone in Cleveland, that would be relatively warm for that time of the year. However, to someone that lives in Miami or Los Angeles, that same temperature would be described as cold. Similarly, if that temperature were to happen in mid-August in Cleveland, most residents would think it is very cold for summer! In addition to this 'spatiotemporal-relativity', the high degree of spatial resolution and the completely automated process is what makes the GWTC different from other similar classifications, such as the Spatial Synoptic Classification (SSC; Sheridan, 2002). That is, instead of finding traditional air masses, the GWTC merely classifies multivariate surface weather situations relative to climatological normal. Thus, associating GWTC weather types to human health and other biological systems that might respond to multivariate departures from normal more-so than raw meteorological conditions may prove useful.
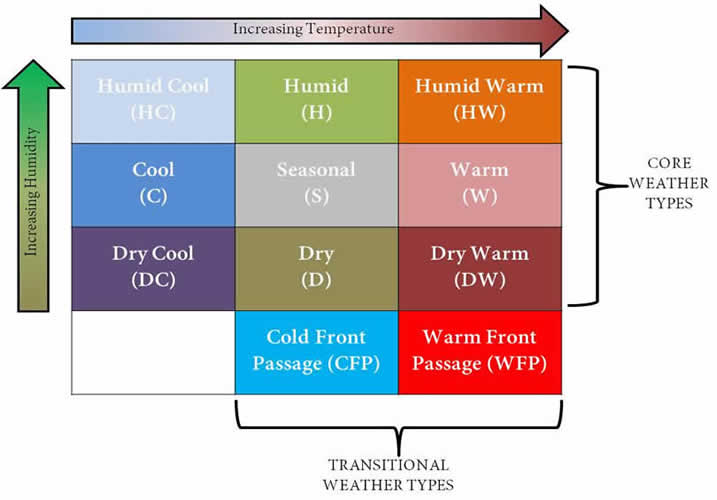
GWTC weather types (modified from Lee, 2015)
The GWTC was developed for my dissertation research in 2014, but has since undergone a couple of updates. The original GWTC used multiple software platforms and covered only the continental United States. However, in 2015 the GWTC was transported to a single software platform and updated to include every other land-based grid point available in the NARR domain (9027 locations); a roughly 64km resolution. Further, the GWTC is now updated annually as the NARR data become available.
Please feel free to use the GWTC data free of charge for scientific research purposes. I only ask that you properly cite my work developing it:
Lee CC. 2014. The development of a gridded weather typing classification scheme. International Journal of Climatology 35, 641-659. DOI: 10.1022/joc.4010.
Other Research Utilizing the GWTC and/or the GWTC-2
Lee CC. 2015. A systematic evaluation of the lagged effects of spatiotemporally-relative surface weather types on wintertime cardiovascular-related mortality across 19 US cities. International Journal of Biometeorology 59(11), 1633-1645. DOI: 10.1007/s00484-015-0970-5.
Lee CC. 2016. Reanalyzing the impacts of atmospheric teleconnections on cold-season weather using multivariate surface weather types and self-organizing maps. International Journal of Climatology 37(9), 3714-3730. DOI: 10.1002/joc.4950.
Lee, C.C., 2020. Trends and variability in air mass frequencies: indicators of a changing climate. Journal of Climate (Accetpted, in press), DOI: 10.1175/JCLI-D-20-0094.1
Lee CC, Sheridan SC. 2018. Trends in weather type frequencies across North America. npj Climate and Atmospheric Science 1(41). DOI: 10.1038/s41612-018-0051-7.