
The Carbon Dioxide (CO2) Problem
The Problem
The carbon dioxide problem can be stated relatively simply:
- More than six and a half billion people burn fuel to keep warm, to provide electricity to light their homes and to run industry, and to move about using cars, buses, boats, trains, and airplanes.
- The burning of fuel produces carbon dioxide, which is released to the atmosphere.
- The burning of fuels adds about 6 gigatons of carbon to the atmosphere each year.
- Carbon dioxide concentrations in the atmosphere have risen from about 270 parts per million (0.026%) before the industrial age to about 380 parts per million (0.038%) by 2006, a 41% increase over pre-industrial values, and a 31% increase since 1870.
- Carbon dioxide is a greenhouse gas, and the increased concentration of carbon dioxide in the atmosphere must influence earth's radiation balance.
Measurements of Temperature and Carbon Dioxide
Measurements of carbon dioxide can be made at any location on earth remote from nearby local sources because the atmosphere is well mixed over periods of a few years. The two most famous sets of measurements were made at Mauna Loa in Hawai'i and at Vostok station in Antarctica.
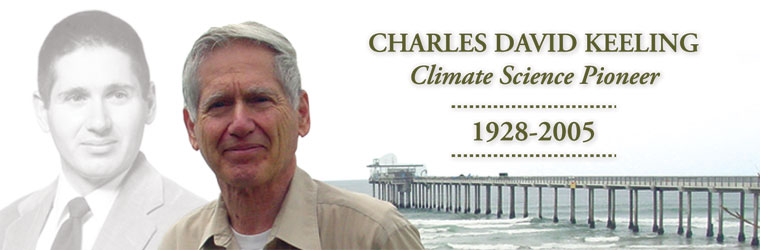
- Charles Keeling began collecting flasks of air from an observatory
at the summit of Mauna Loa in Hawai'i in 1959. Keeling,
the first to confirm the rise of atmospheric carbon dioxide by very
precise measurements that produced a data set now known widely as the "Keeling
Curve." Prior to his investigations, it was unknown whether the
carbon dioxide released from the burning of fossil fuels and other
industrial activities would accumulate in the atmosphere instead of
being fully absorbed by the oceans and vegetated areas on land. From
Charles David Keeling: Climate Science Pioneer.
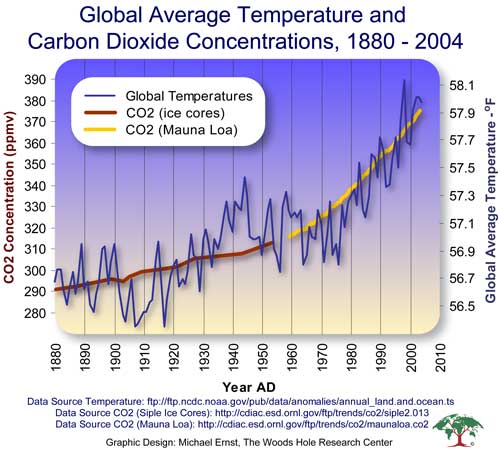
Carbon dioxide concentration in the atmosphere measured by David Keeling and colleagues at Mauna Loa, Hawai'i and from polar ice cores, with average global surface temperature of earth.
Image from Woods Hole Research Center, presentation by Director John P. Holdren, The Scientific Evidence.
- The Vostok
ice core is a cylinder of ice collected by drilling from the surface
to near the bottom of the Antarctic ice sheet. Total length was 2083
meters, brought back in 4-6 meter sections. The core shows annual layers,
which can be used to date the air bubbles trapped in the ice. Analysis
of the gas content of the bubbles gives the concentration of carbon
dioxide in the atmosphere when the ice formed. Ratios of oxygen isotopes
and deuterium gives air temperature at the station at the time ice
was formed.
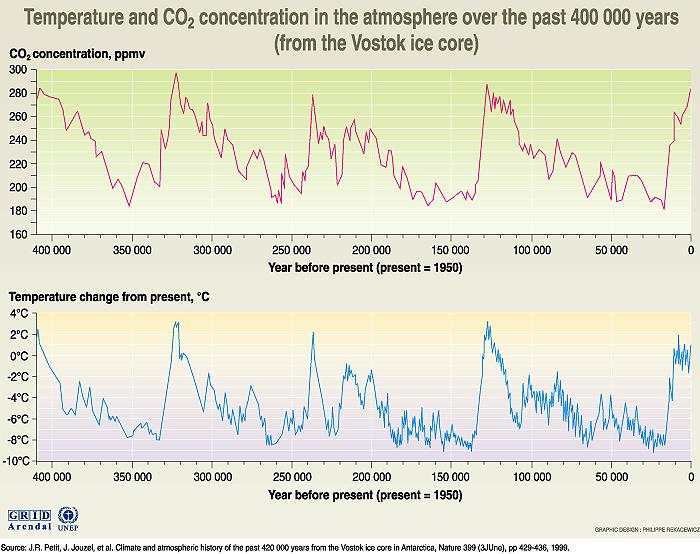
Atmospheric carbon dioxide concentration calculated from air bubbles trapped in the Antarctic continental glacier and cored at the Vostok ice Station. Notice that present carbon dioxide concentrations far exceed all values for the past 400,000 years, and that the concentration is high when temperature is high. This does not imply cause or effect. Both carbon dioxide and temperature are linked through feedback loops. Both variables change over periods of around 100,000 years due to slow variations in earth's orbit and spin axis. To learn more about the relation between carbon dioxide and temperature, we need other data and information.
Image from UNESCO Introduction to Climate Change, GRID-Arendal.
- The page on Evidence for Global Warming has more information on ice cores and other sources of information.
Sources of Anthropogenic (Human-Produced) Carbon Dioxide
Anthropogenic (human-produced) carbon dioxide is mostly from the burning of fossil fuel: coal, oil, and natural gas. The burning of forests to produce agricultural land, and the burning of forest wood for heating and cooking add smaller amounts. The following information comes mostly from the Statistical Review of World Energy 2005 by British Petroleum. For updates see Statistical Review.
- Global energy use from fossil fuels was approximately 8,260 million metric tons oil equivalent, which is approximately 9,623 X 109 m3 = a cube of oil 2.12 km on a side.
- Global oil consumption in 2003 was 76,800,000 barrels of oil per day. Most of the remainder of our energy comes from natural gas and coal.
- Per capita consumption of energy in the United States is about 57 barrels of oil equivalent per year. The energy is used to heat and light homes, offices, and stores, to power trucks and automobiles, and to operate machinery. 57 barrels of oil at $50/barrel = $2,850. If the energy were used entirely as electricity, it would cost about $7,300 per person per year.
- Consumption of energy in the United States was approximately:
- 89.4% from burning fossil fuels.
- 39.1% oil
- 25.9% natural gas
- 24.4% coal
- 8.1% from nuclear energy
- 2.5%from hydroelectric power plants
- 89.4% from burning fossil fuels.
- The United States used approximately 24% of all the world's energy, although we are only 4.6% of the world's population.
Anthropogenic sources are a small part of the global carbon system. Their production mixes with carbon dioxide released by the respiration of plants and animals, and through the decay of carbon-based material from plants and animals.
Other Greenhouse Gases
Carbon dioxide is one of several greenhouse gases released in large quantities by human activities. The important gases are:
- Water vapor. This is by far the most important greenhouse gas. It evaporates mostly from the ocean, and it causes earth's surface to be about 30°C warmer (out of the 33°C of warming caused by all greenhouse gases combined). See Ocean and Climate for a discussion of how much water warms the atmosphere.
- Carbon dioxide.
- Methane.
It is produced
by bacteria in wetlands and bogs, cattle, rice paddies, termites,
landfills, and coal mining. About two thirds
of the emissions into the atmosphere come from human activity, mostly
in the northern hemisphere. Methane concentration was 1783 parts
per billion in 2004, which was 155% larger than pre-industrial concentrations.
The rise in methane appears to have leveled off, and concentrations
have increased only 5 parts per billion since 1999. Methane does not
remain long in the atmosphere, about 8 years (Fischer et al, 2008),
so emissions and sinks are already close to balance. One pound of
methane is 22 time more effective in absorbing infrered radiation
than is a pound of carbon dioxide.
The Environmental Protection Agency has a web page listing the amounts
emitted by various sources.
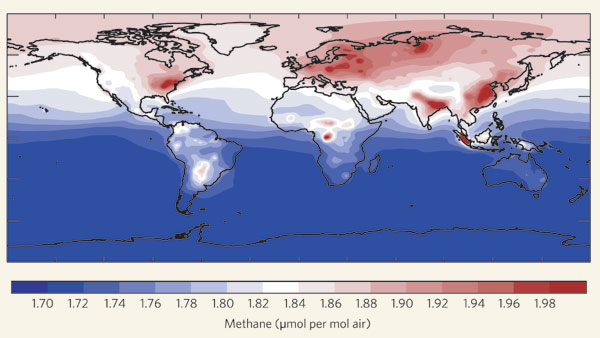
Average methane mixing ratios in the boundary layer (the layer of the atmosphere in immediate contact with Earth's surface) in 2003, calculated with a chemistry–transport model. The atmospheric lifetime of methane is almost a decade, so it disperses globally. Regions of strong emissions are nevertheless manifest, leading to the largest variability in the northern hemisphere and an inter-hemispheric difference of 5–10%. The recently proposed release of methane by terrestrial vegetation is not included, as its magnitude is still uncertain. Figure and text are from Lelieveld (2006), who redrew the figure from Houweling (1999).
- Nitrous oxide, from microbes in the soil and the ocean, and from burning fossil fuels at high temperatures, such as car engines. About one-third of the emissions into the atmosphere come from human activity. N2O concentrations were 319 parts per billion in 2004, which was 18% larger than pre-industrial concentrations. Its lifetime in the atmosphere is similar to that of carbon dioxide, about a century.
- Halocarbons such as refrigerants used in air conditioners .
- Tropospheric ozone, produced in smog.
Further Reading
For more information see Environmental Protection Agency's Global Warming Site.
References
Houweling, S., T. Kaminski, F. Dentener, J. Lelieveld, and M. Heimann (1999). Inverse modeling of methane sources and sinks using the adjoint of a global transport model. Journal of Geophysical Research 104 (D21): 26,137–26,160.
Fischer, H., M. Behrens, et al. (2008). Changing boreal methane
sources and constant biomass burning during the last termination. Nature 452
(7189): 864–867.
Lelieveld, J. (2006). Climate change: A nasty surprise in the
greenhouse. Nature 443 (7110): 405–406.
Revised on: 29 May, 2017