| How do I get started? Go to the species list, click on a species name, and see a species page. Alternatively, you can simply page through the species lists and "browse". In a future version, we plan to have the pages cross-linked so that assemblages can be presented. What is a Species Page? A Species Page shows the species name, author, and year described (see Taxonomy References for sources), species image(s) of the ostracode shells, Presence-Absence Distribution, and Distribution in Solute Space. What does the North America map show? Species Presence-Absence Distribution: (See right column for example). Each species page in NANODe shows the distribution map of sample sites (white triangles). Red circles indicate those sites where the particular species was found living and white triangles indicate the sites were sampled for ostracodes, but that particular species was not found. What are the images? Species Images: Each species page in NANODe shows at least one image of the ostracode shell with a scale bar: in some cases, males and females are imaged, in other cases, there may be an image of the shell and also a close-up of a particular shell feature. In a few instances, we have not yet posted an image: we hope to attend to those shortly when we acquire pristine shells that will photograph well. What does the graph show? Species Distribution in Solute Space: Non-marine ostracodes have demonstrated preferences for specific ranges of major ion concentration and composition. We find the most useful way of portraying these preferences is by plotting their distributions in hydrochemical or solute space (see graph on right). |
Example
Figures
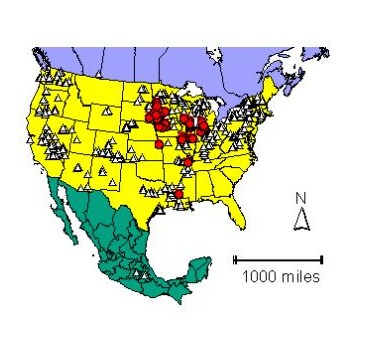 Example of Species Presence-Absence Distribution Map
for Candona acuta Hoff, 1942  Example Species Image shown here is
Candona acuta Hoff, 1942 ________________________________________________  Example of Species Distribution in solute space
(Species shown is Candona acuta Hoff, 1942). All the NANODe sites are shown on each solute space diagram as white triangles. Those sites in which the particular species is found living are shown plotted as red circles. In this way, you can see the species preference for salinity (TDS mg/L) and also its solute tolerance. The x axis is total dissolved solids (TDS in mg/L), and the y axis is a ratio of Carbonate and Bicarbonate to Calcium in meq/L. A log scale is used for both axes. The distribution of all NANODe sites plotted on this graph clearly shows the calcite branch point, the first mineral branch point in natural waters, around 300 mg/L. With increasing concentration, the point of calcite saturation is reached and calcite precipitates, removing bicarbonate and calcium in 1:1 proportion. Natural water is rarely perfectly balanced regarding bicarbonate and calcium, and thus as total concentration rises, the water becomes enriched in calcium relative to bicarbonate, or enriched in bicarbonate relative to calcium. All the NANODe sites are shown on each solute space diagram as white triangles. Those sites in which the particular species is found living are shown plotted as red circles. In this way, you can see the species preference for salinity (TDS mg/L) and also its solute tolerance. |